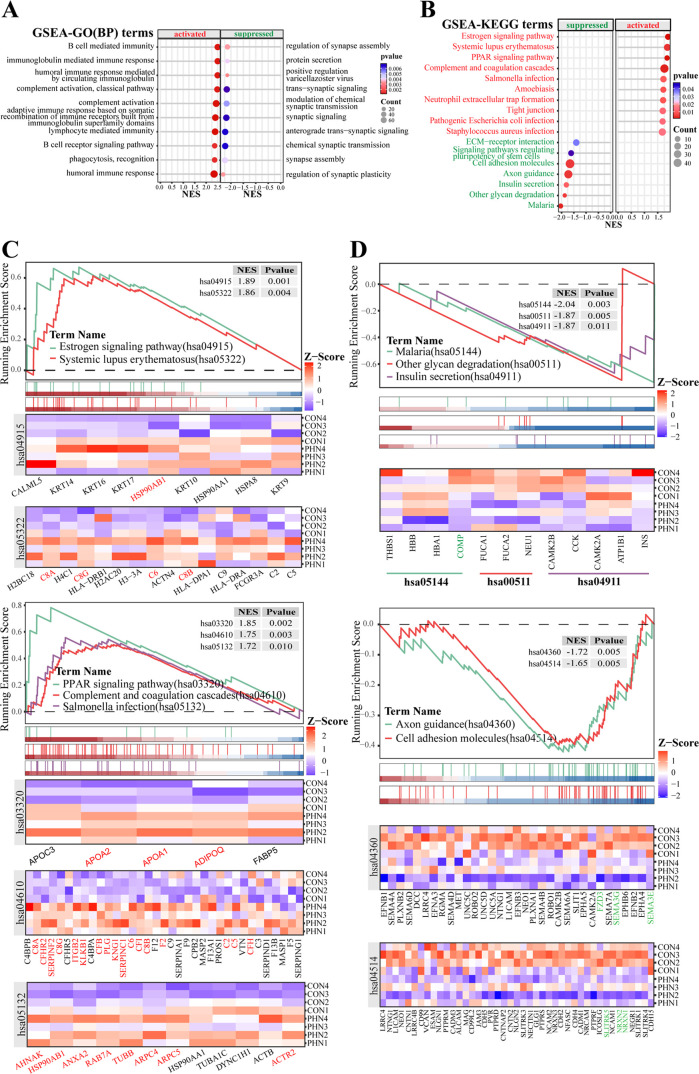
Figure 5.
GSEA-GO(BP) and GSEA-KEGG analysis (A): dotplot of the top 10 activated and suppressed terms based on the GSEA-GO(BP) category (B). Dotplot of the top 10 activated and top 7 suppressed pathways (C, D). Enrichment plot and heatmap of core-enrichment proteins for the top 5 activated and top 5 suppressed pathways of GSEA-KEGG results.

