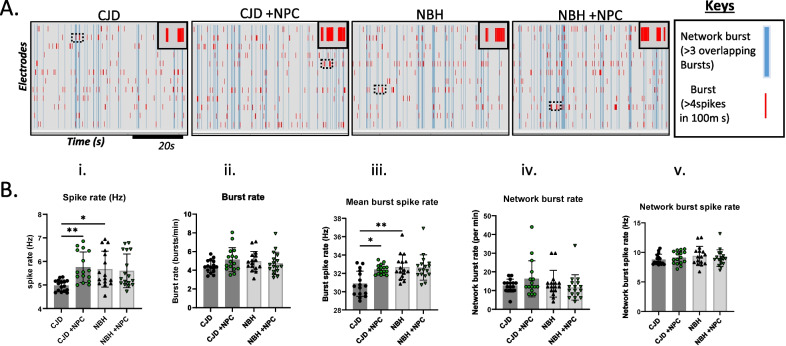
Fig. 3.
Neuronal network activity in NPC-seeded or unseeded COs following ~ 180 days of inoculation with normal brain homogenate (NBH) or CJD brain homogenate. A Raster plots displaying bursts (each red line indicates a burst) and network bursts (each blue line indicates overlapping bursts between > 3 electrodes) over a ~ 60 s recording. The top-right corner inset displays a zoom-in of the bursts within the dotted rectangular box. Keys are displayed on the right panel. B Parameters can be calculated from the raster plots that broadly translate to the functioning of neurons in the brain. Neuronal population network activity is measured as (i) spike rate (action potentials), (ii) burst rate (periods of rapid action potential spiking), (iii) spike rate in bursts (average number of spikes per burst), (iv) network burst count (burst occurring in synchrony on multiple electrodes indicating wider neuronal network communication), and v) spike rate in network burst (average action potential spiking in synchronized bursts on multiple electrodes). B Average means were compared between groups by the Kruskal–Wallis test with Dunn’s correction for multiple comparisons. Each dot is an “n” representing an organoid (n = 15–17). Data are presented as mean ± SD. *p < 0.05, **p < 0.01

