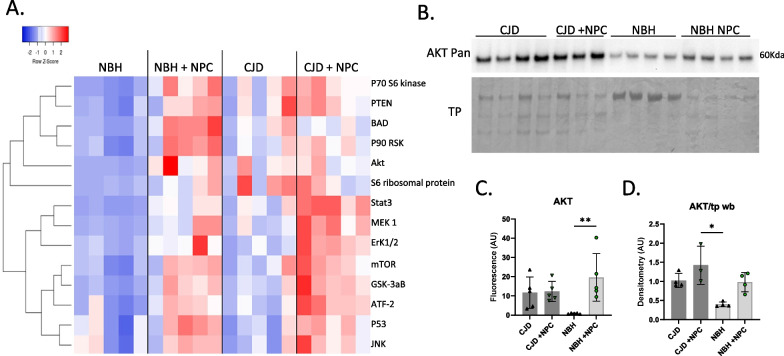
Fig. 5.
Analysis of cell signaling intermediates changed as a result of infection and NPC seeding. A Heat map of multiplex immunoassay data for signal transduction intermediates showing Z-scores of 5 organoids per treatment. B Western blotting of pan AKT for validation of the Bioplex signaling array data (un-cropped blot images can be found in Additional file 1: Fig. S8). C Bioplex AKT quantification (mean fluorescence normalized to total protein). D Quantification of western blot AKT (Pan) normalized to total protein (Coomassie). Markers on graphs represent individual organoids with shaded bars showing the mean and error bars showing the SD. Statistics were preformed using Kruskal–Wallis test with Dunn’s correction for multiple comparisons. **p < 0.01, *p < 0.05

