Fig. 3.
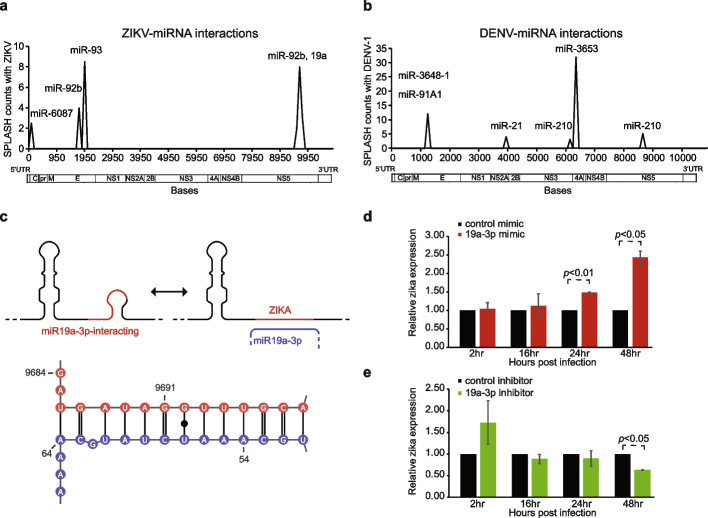
DENV and ZIKV interact with host miRNAs. a, b Line plot showing the locations along ZIKV (a) and DENV (b) that interact with host miRNAs. Y-axis indicates the number of interaction counts between the virus genome and a specific miRNA. The X-axis indicates the position along the virus genome. c Top, secondary structure modeling of ZIKV genome before and after miR-19a-3p binding. Bottom: Predicted ZIKV: miR-19a-3p interactions using the program RNAcofold. The ZIKV interacting sequence is in red and the miRNA sequence is in blue. d, e Bar charts showing the amount of Zika virus detected inside Huh7 cells using qPCR, 2, 16, 24, and 48 h post-infection in cells that are transfected with miR-19a-3p or control (d), or in cells that are transfected with miR-19a-3p inhibitor or control (e). The data in cells with over-expression of miR-19a-3p or inhibitor is normalized to its control

