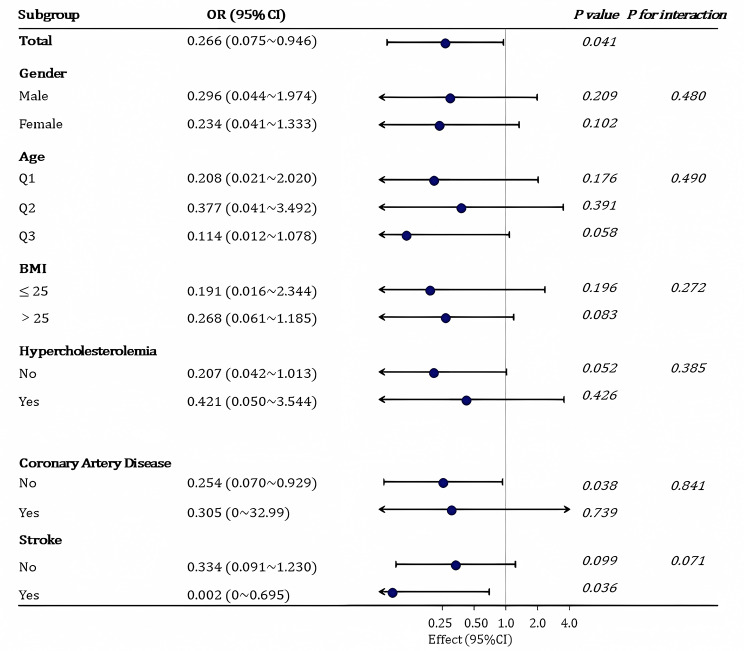
Fig. 3.
The relationship between dietary UFA/TF and insulin resistance in different subgroups
Note: The subgroup analysis was adjusted for the effects of the following covariates: age, gender, BMI, race, total energy intake, total protein, total carbohydrate, total sugars, total dietary fiber, total fat, alcohol consumption, diabetes, and hypercholesterolemia. Logistic regression model subgroup analysis was used with a statistical significance level of p < 0.05

