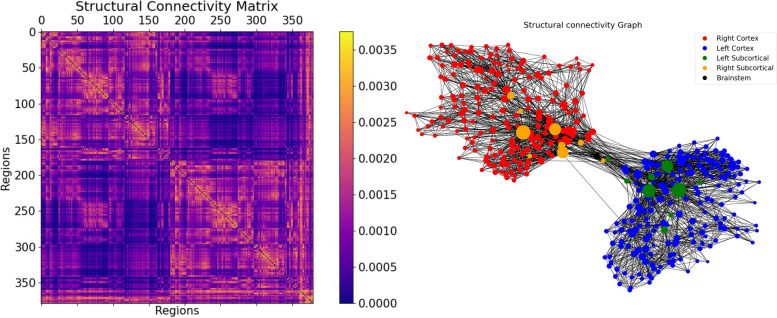
Fig. 3.
Visualization of the SC graph, in matrix form (left) and as a graph showing the strongest 5% of connections. Node positions are computed with Fruchterman and Reingold’s [44] algorithm, which assumes stronger forces between tightly connected nodes. Besides the high degree of symmetry, we can observe the laterality is kept in the graph structure (also for subcortical regions). Node size linearly represents the graph theoretical measure of structural degree for each node. As we can see, the most important hubs are in the subcortical regions

