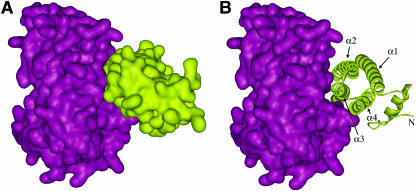
Figure 5.
Molecular Surface of the PME-PMEI Complex.
(A) Representation of the molecular surface of the enzyme (violet) and the inhibitor (yellow) in the complex.
(B) Same view of the complex as in (A), showing the molecular surface of PME and a ribbon diagram of PMEI. The α-helices α2, α3, and α4 of the inhibitor fit into the substrate binding cleft of the enzyme.

