Figure 2.

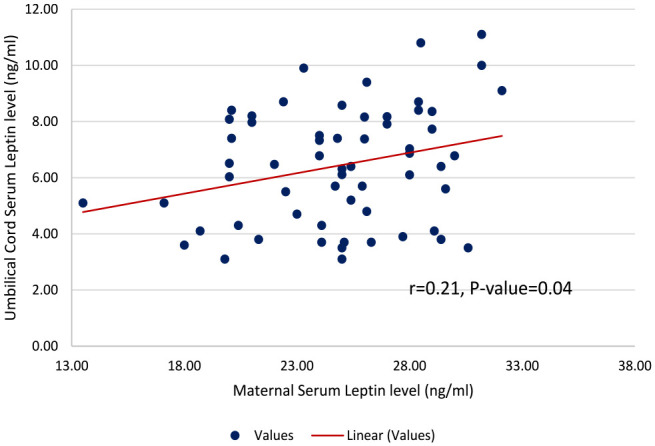
Scatterplot showing the level of linear correlation between maternal serum leptin and umbilical cord serum leptin in the pre-eclamptic group (r = 0.217, p = 0.04).

Scatterplot showing the level of linear correlation between maternal serum leptin and umbilical cord serum leptin in the pre-eclamptic group (r = 0.217, p = 0.04).