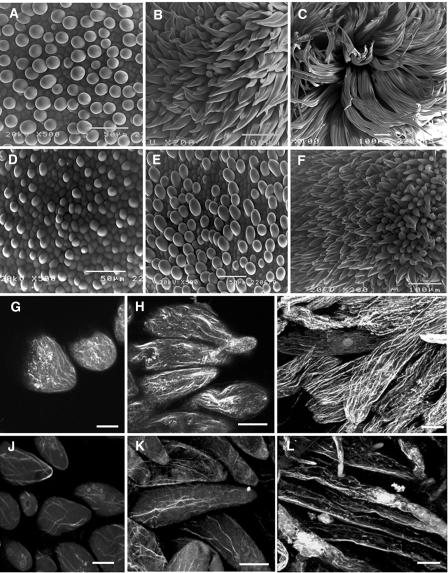
Figure 9.
Comparison of Fiber Growth Rate and F-Actin Organization in Fiber Cells between Transgenic GhACT1 RNAi and Wild-Type Plants.
(A) to (F) Scanning electron micrographs of the ovule surface of transgenic GhACT1 RNAi and wild-type plants.
(A) to (C) Ovules of wild-type plants at 1 (A), 2 (B), and 3 (C) DPA. Note the length of fibers increases with time.
(D) to (H) Ovules of transgenic plants at 1 (D), 2 (E), and 3 (F) DPA. Note the length of fibers is much shorter than that in wild-type plants at the same stages.
(G) to (L) Organization of actin filaments in fiber cells of wild-type and transgenic GhACT1 RNAi cotton.
(G) to (I) Fiber cells of wild-type cotton at 1 (G), 2 (H), and 3 (I) DPA. Actin filaments were organized into arrays parallel to the growing axis and extended into the tip of the fiber cells at 1 DPA (G). Actin filaments were arranged into thin arrays and thick cables along the shank in fiber cells at 2 DPA (H) and assumed a more complicated net structure of thick and longitudinally extending cables in >3-DPA fiber cells (I).
(J) to (L) Fiber cells of transgenic cotton at 1 (J), 2 (K), and 5 (L) DPA. Fewer F-actin cables were present.
Bars = 5 μm in (G) and (J) and 10 μm in (H), (I), (K), and (L).

