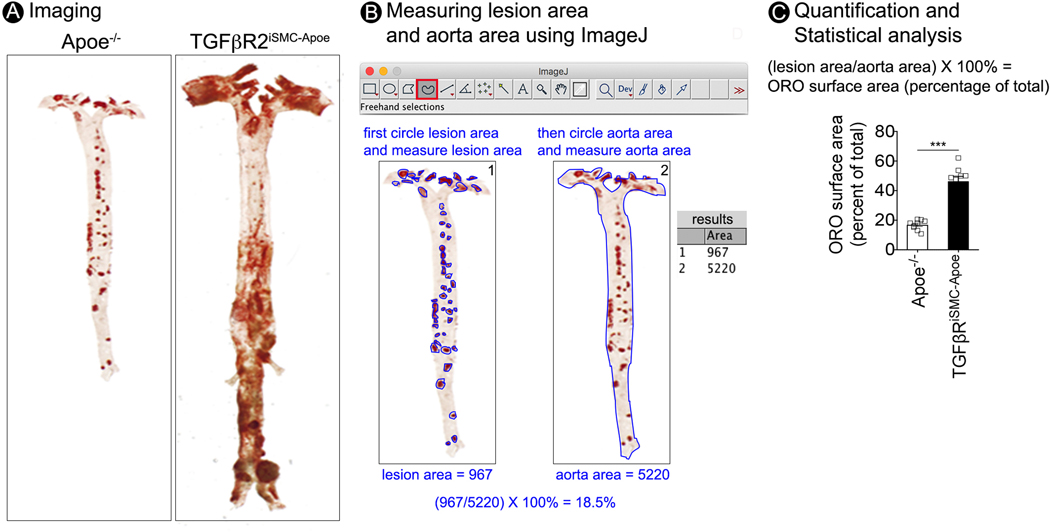
Figure 6.
Step-by-step protocol for en face aorta imaging and atherosclerotic lesion quantification. (A) Microphotographs of en face aortas from Apoe−/− and TGFβR2iSMC-Apoe mice after 4 months of HCHF diet stained with Oil Red O. (B) Images illustrating the process for computer-assisted quantification of the atherosclerotic lesions. (C) Lesion area quantification: % lesion area refers to Oil Red O stained as a % of the total aortic surface. All data shown as mean ± SEM ( ***p<0.001; unpaired two-tailed Student’s t test) (for each time point N=9 for Apoe−/− mice; and N=9 for TGFβR2iSMC-Apoe mice).

