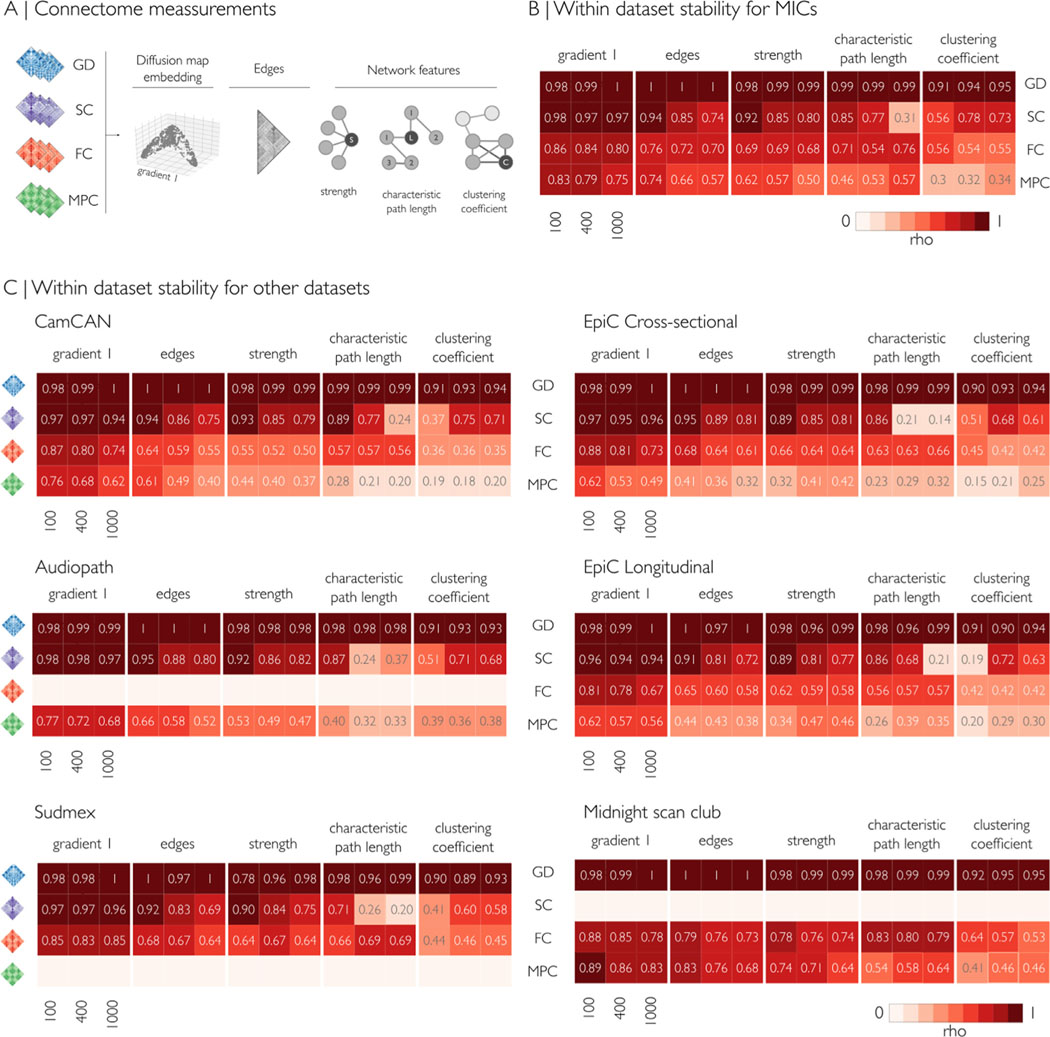
Fig. 3.
Within dataset mean consistency, indicating the correlation between subject- and group-level measurements (Spearman’s rho), for Schaefer-100, Schaefer-400, and Schaefer-1000 parcellations. (A) For each modality, five measurements were evaluated: principal gradient, edges, node strength, path length, and clustering coefficient. Empty rows indicate modalities that were not analyzed due to missing acquisitions. (B,C) Across datasets, correlations were highest for GD and SC, followed by FC and MPC. Gradient 1 was the most consistent measure across parcellations and modalities, followed by edges and node strength. Overall, characteristic path length was similar at lower granularity (100 parcels) but increasingly dissimilar at higher granularity (1000 parcels). Clustering coefficient had variable patterns depending on the modality and granularity. MPC: microstructural profile covariance, FC: functional connectivity, SC structural connectivity, GD geodesic distance.

