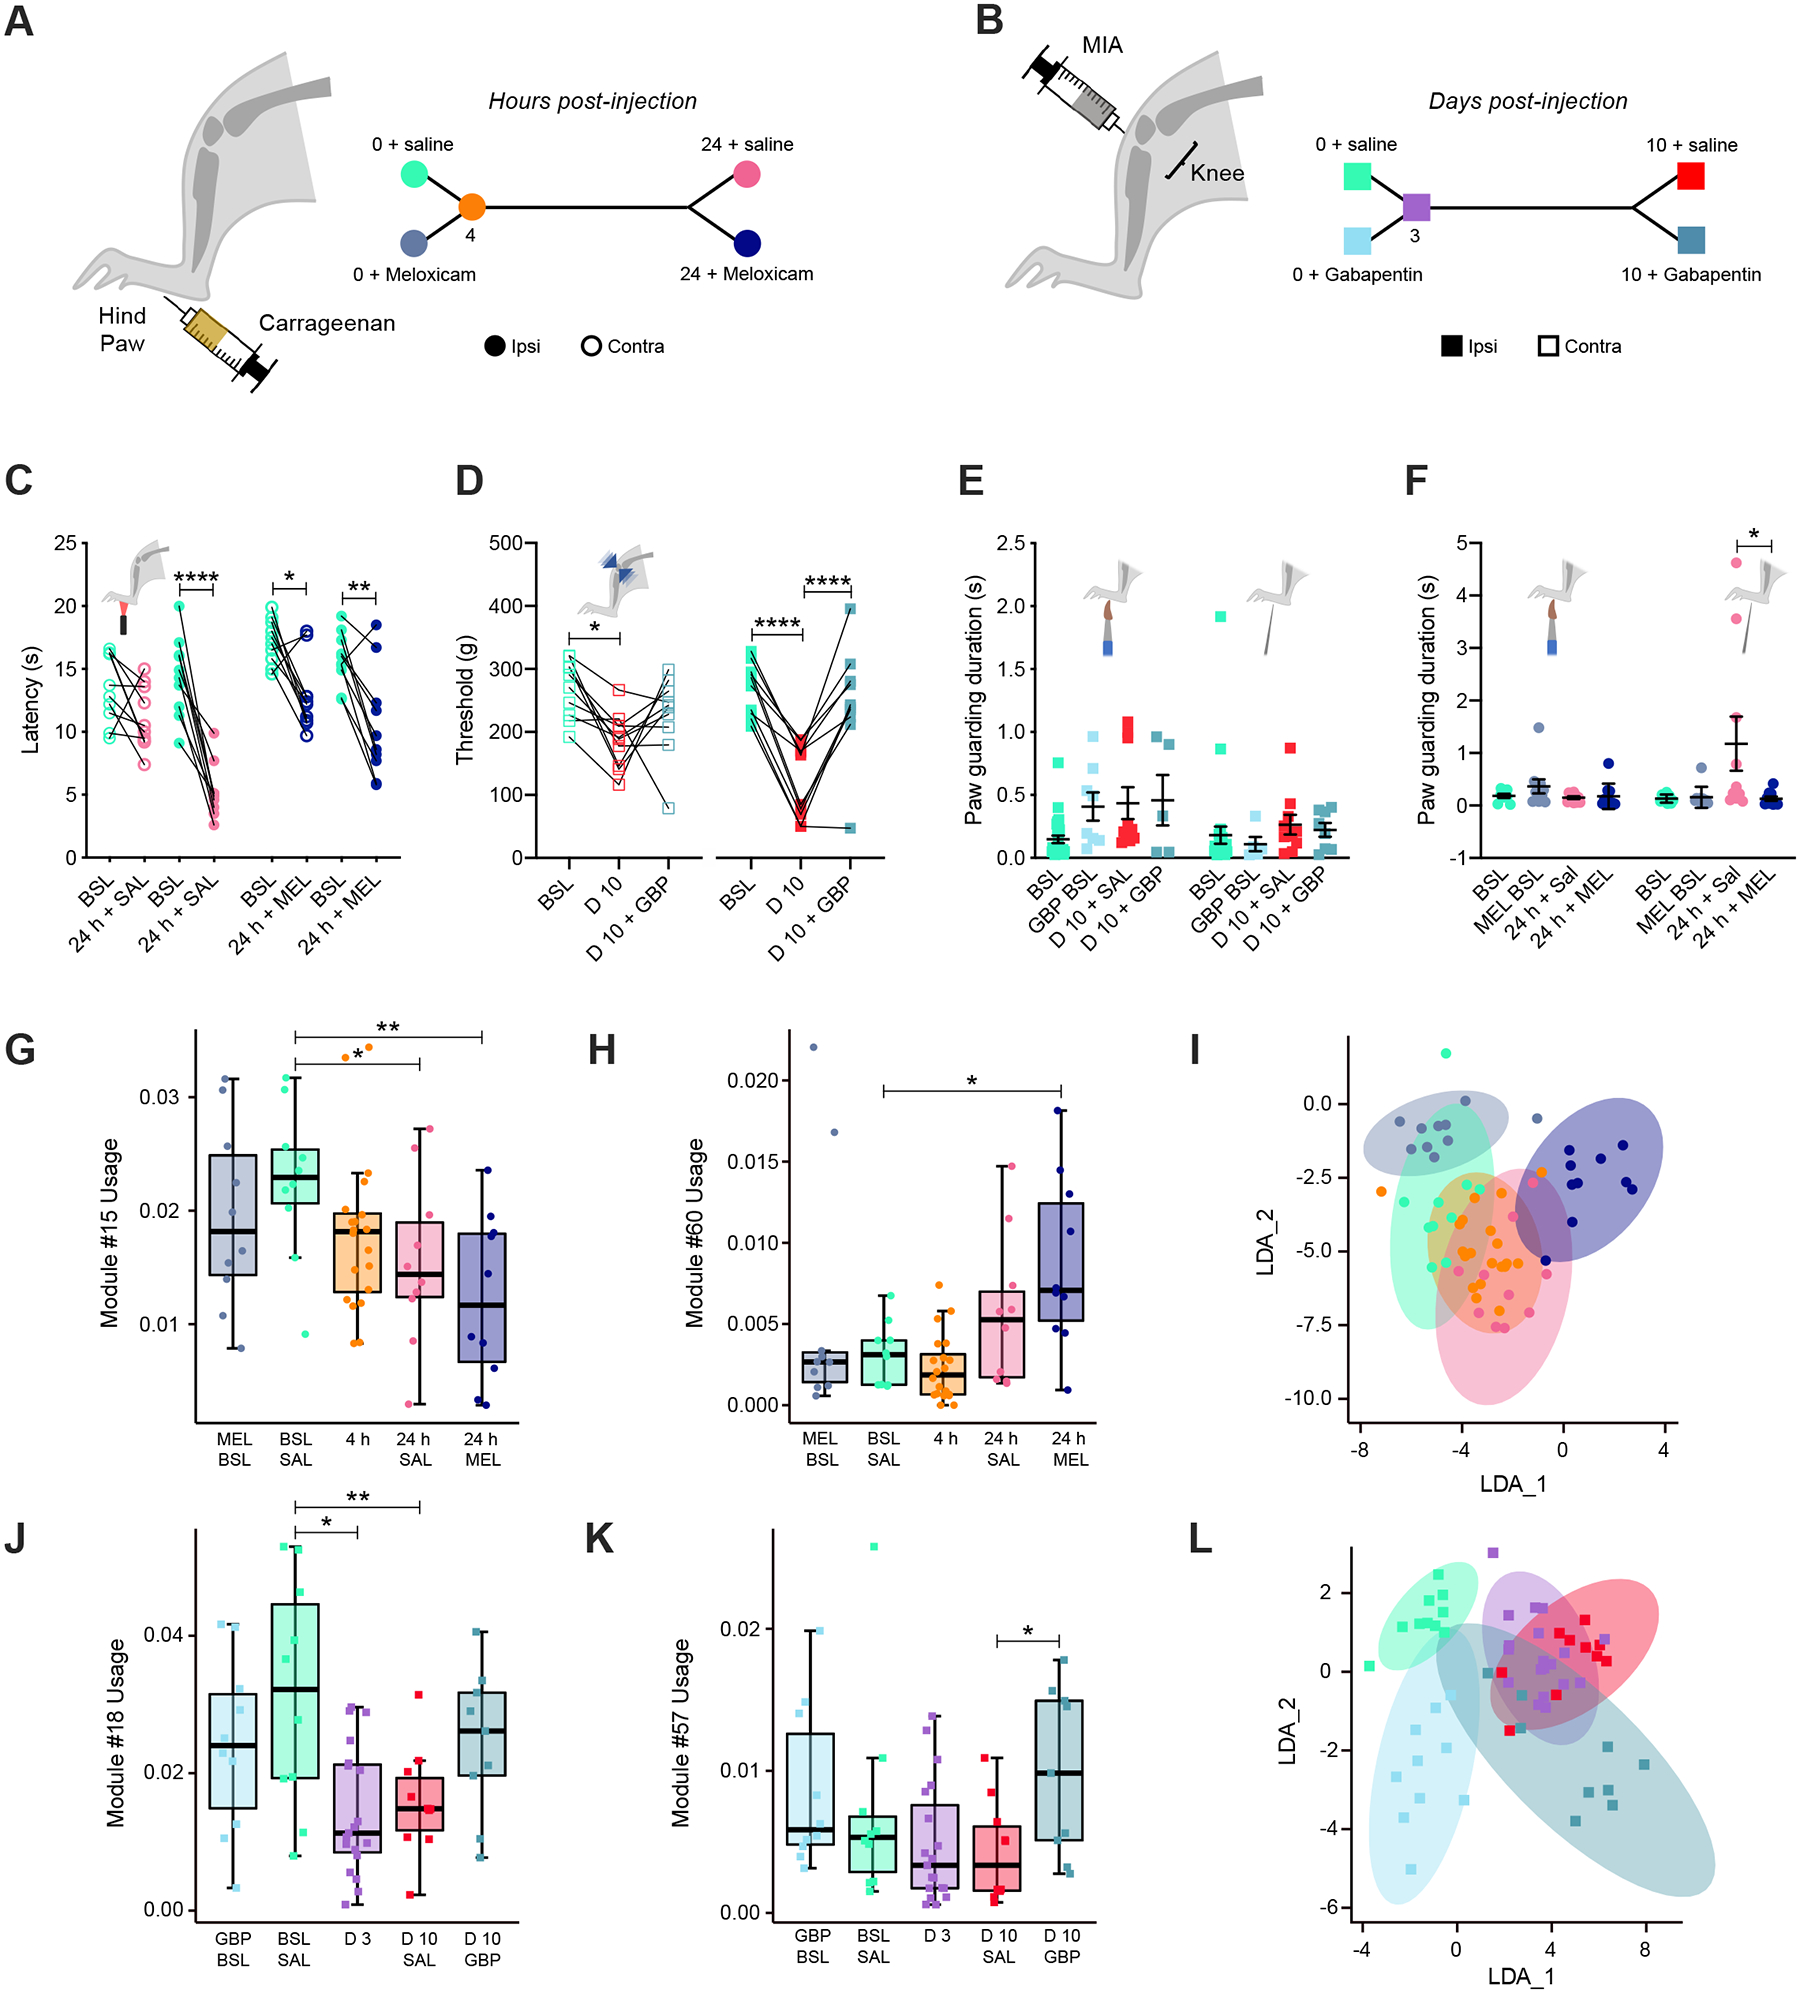
Figure 4. Meloxicam relieves affective features of hyperalgesia but it does not promote return to pre-inflammation spontaneous behavior, while gabapentin improves spontaneous signatures of MIA-induced knee injury.

(A) Timeline of the experiment. Mice were tested at baseline and after intraplantar injection of 20 μl 3% carrageenan at 4-hours post-injection, then at 24-hours after intraperitoneal injection of saline or meloxicam. (B) Timeline of the experiment. Mice are tested at baseline and after intra articular knee injection of 10 μl 0.1mg/ul MIA at 3-days post-injection, then at 10-days after intraperitoneal injection of saline or gabapentin. (C) Hargreaves measurement of carrageenan-induced heat hypersensitivity at baseline, 24-hours following carrageenan injection, as well as pain relief by meloxicam at 24-hours, ipsi- (full circles) and contralateral (empty circles) to paw injection. (D) Measurement of MIA-induced pressure knee hypersensitivity at baseline, 10-days following MIA knee injection, as well as pain relief by gabapentin at 10-days, ipsi- (full squares) and contralateral (empty squares) to knee injection. (E) Paw guarding duration is measured with machine learning at baseline, and post-carrageenan injection at 4-hours, and 24-hours after saline or meloxicam intraperitoneal injection following dynamic brush (left) or light pinprick (right). (F) Paw guarding duration is measured with machine learning at baseline, and post-MIA knee injection at 3-days, and 10-days after saline or gabapentin intraperitoneal injection following dynamic brush (left) or light pinprick (right). (G-I) 3D pose analysis of spontaneous behavior of 5 groups: baseline + meloxicam intraperitoneal injection, baseline + saline intraperitoneal injection, 4-hours post-carrageenan paw injection, 24-hours post-carrageenan paw injection + saline intraperitoneal injection, 24-hours post-carrageenan paw injection + meloxicam intraperitoneal injection. (G) Spontaneous rearing behavior is decreased after paw carrageenan injection, further decreased by meloxicam intraperitoneal injection (example module #15 among other rearing modules downregulated, see Table 2). (H) Spontaneous grooming behavior is increased after paw carrageenan injection, further increased by meloxicam intraperitoneal injection (example module #60). (I) Representation of LDA of raw usage for the five different groups. (J-L) 3D pose analysis of spontaneous behavior 5 groups: baseline + gabapentin intraperitoneal injection, baseline + saline intraperitoneal injection, 3-days post-MIA knee injection, 10d post-MIA knee injection + saline intraperitoneal injection, 10-days post-MIA knee injection + gabapentin intraperitoneal injection. (J) Spontaneous rearing behavior is decreased after knee MIA injection, which can be resolved after gabapentin intraperitoneal injection (example module #18). (K) Locomotion is affected after knee MIA injection, which can be resolved after gabapentin intraperitoneal injection (example module #57). (L) Representation of LDA of raw usage for the five different groups. (I-L) While the point clouds in Figure 4I and 4L do show some overlap between conditions, cohorts can be distinguished by their module usage, which we quantified by computing the F1 of the LDA in predicting the condition of the held-out animals (F1-scores: CAR bsl+saline = 0.57, CAR bsl+meloxicam = 0.50, CAR 4h = 0.67, CAR 24h+saline = 0, CAR 24h+meloxicam = 0.40, overall model accuracy = 0.50 better than “pure-chance” = 0.20 and randomized data). For accuracy, we report F1, the harmonic mean of precision and recall.
For 3D pose analysis, baseline+saline (bsl+sal) n= 10 animals, baseline+meloxicam (bsl+mel) n= 10 animals, baseline+gabapentin (bsl+gbp) n= 10 animals, 4h post-carrageenan n= 20 animals, 24h post-carrageenan+saline (24h+sal) n= 10 animals, 24h post-carrageenan+meloxicam (24h+mel) n= 10 animals, D3 post-MIA n= 20 animals, D10 post-MIA+saline (D10+sal) n= 10 animals, D10 post-MIA+gabapentin (D10+gbp) n= 10 animals, Statistical analysis: corrected bootstrap t-test.
