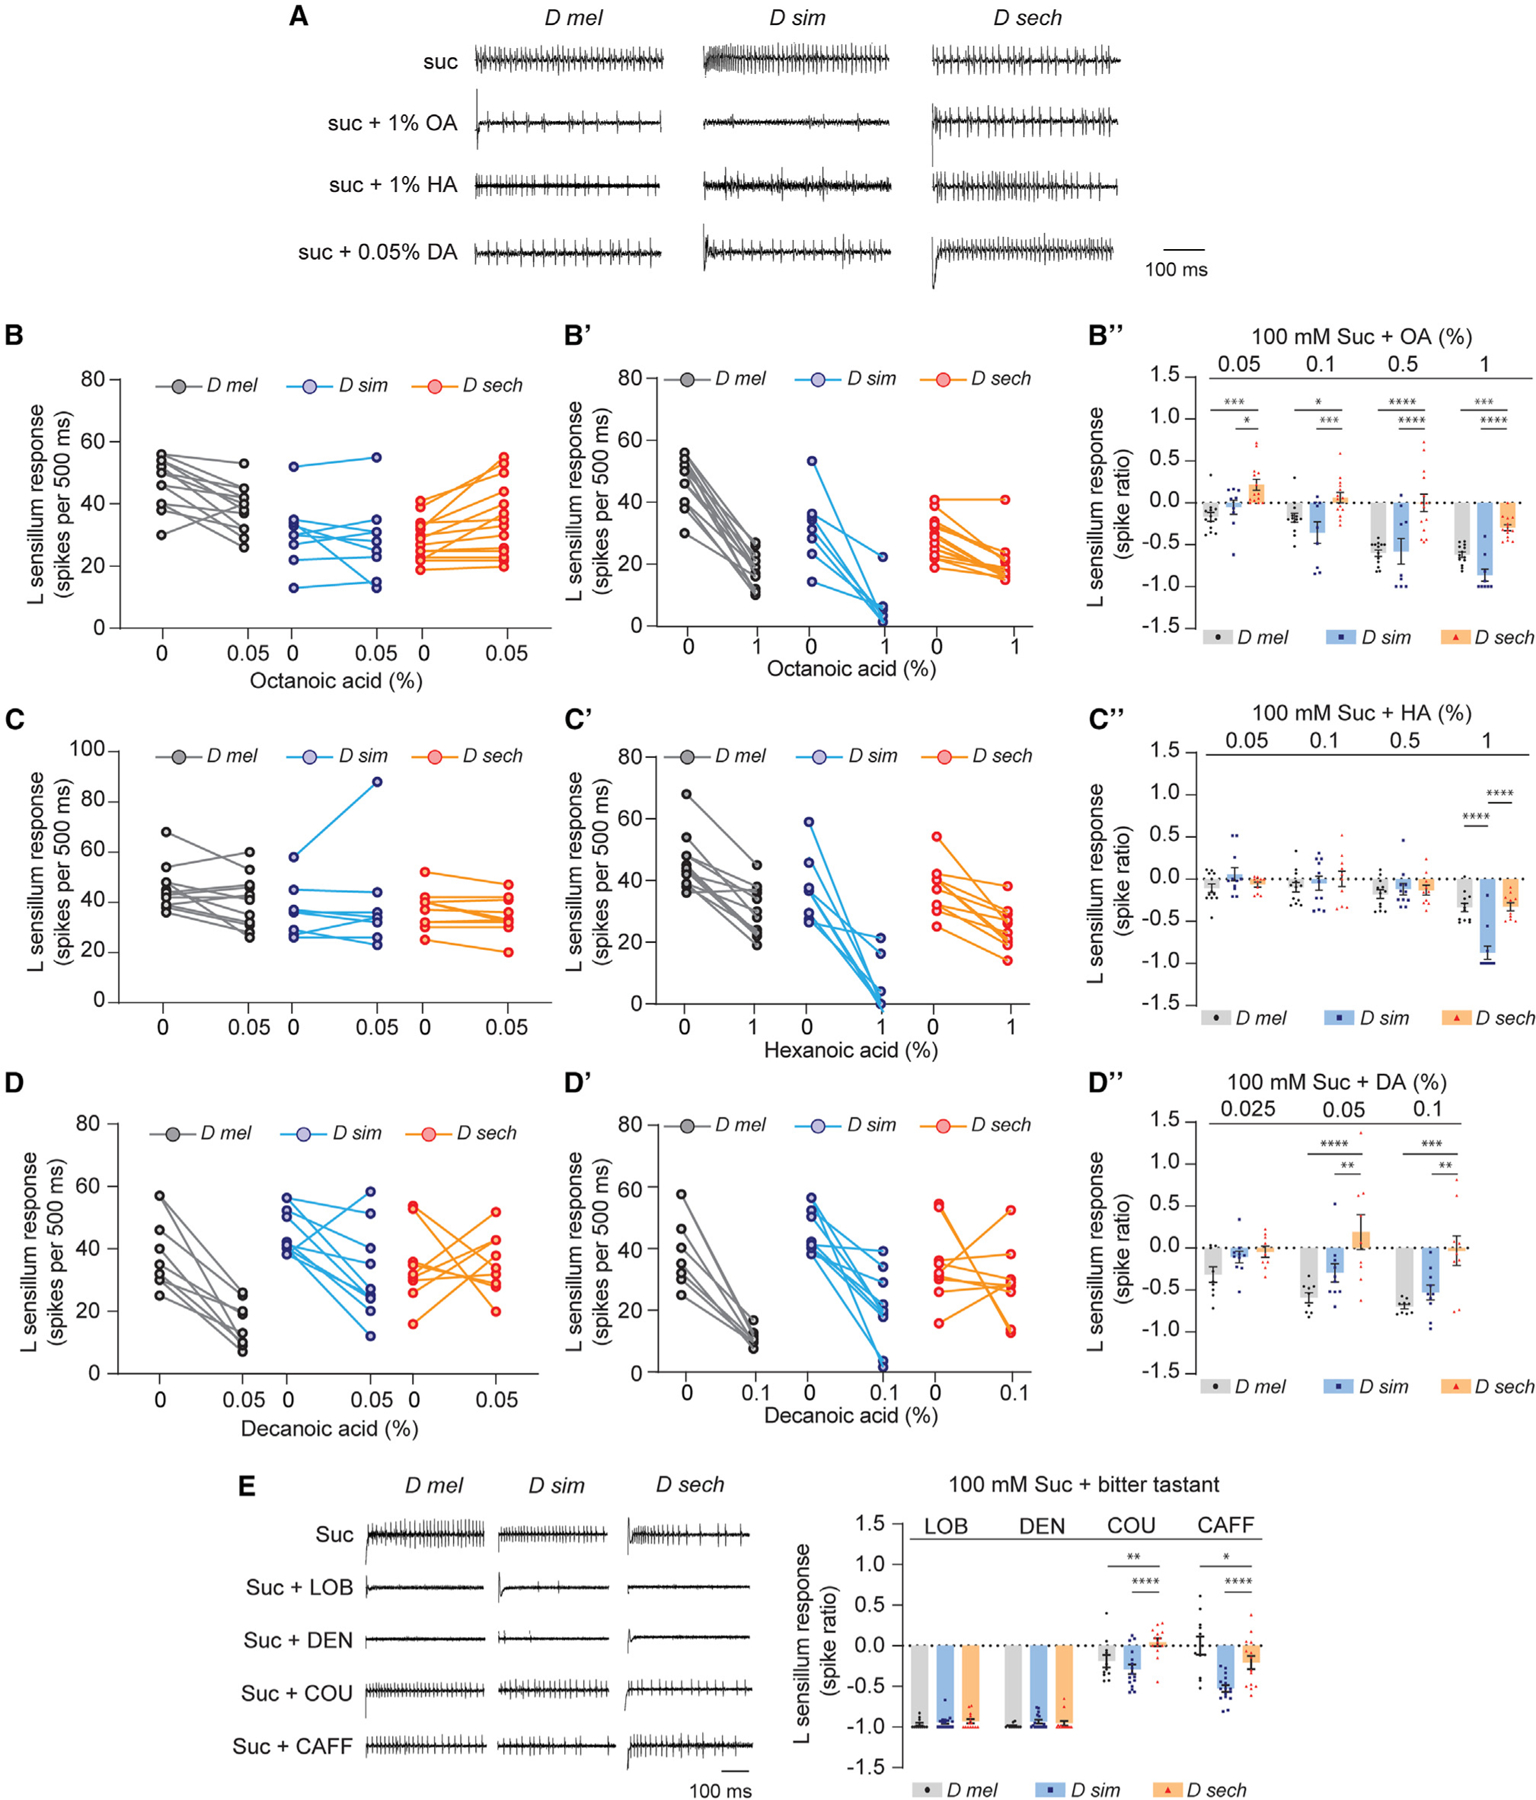
Figure 4. Noni FAs modulate sweet taste in a species-specific manner.

(A) Representative traces of recordings from L-type sensilla in named Drosophila species stimulated with 100 mM sucrose alone (suc) or in mixtures with octanoic acid (OA), hexanoic acid (HA), or decanoic acid (DA). Traces show the first 500-ms period upon stimulation with indicated tastant.
(B and B”) Paired recordings from L-type sensilla of named Drosophila species with 100 mM sucrose alone (0) or in a mixture with OA (%). (B”) L-type sensillum responses to mixtures of 100 mM sucrose with varying concentrations of OA relative to 100 mM sucrose alone (depicted as spike ratios). n = 13 (D mel), n = 9 (D sim), n = 14 (D sech) from five flies.
(C and C’) Paired recordings from L-type sensilla of named Drosophila species with 100 mM sucrose alone (0) or in a mixture with HA (%). (C”) L-type sensillum responses, calculated as in (B”), to mixtures of 100 mM sucrose with varying concentrations of HA relative to 100 mM sucrose alone. n = 12 (D mel), n=9 (D sim), n = 10 (D sech) from four flies.
(D and D’) Paired recordings from L-type sensilla of named Drosophila species with 100 mM sucrose alone (0) or in a mixture with DA (%). (D”) L-type sensillum responses, calculated as in (B”), to mixtures of 100 mM sucrose with varying concentrations of DA relative to 100 mM sucrose alone. n = 9 (D mel), n = 10 (D sim), n = 9 (D sech) from four flies.
(E) Representative traces and L-type sensillum responses, calculated as in (B”), to mixtures of 100 mM sucrose with bitter tastants lobeline (LOB, 10 mM), denatonium (DEN, 10 mM), coumarin (COU, 3 mM), and caffeine (CAFF, 10 mM), relative to 100 mM sucrose alone. n = 9 from four to five flies for each tastant-species combination. Data in (B”), (C”), (D”), and (E) were analyzed using two-way ANOVA for repeated measures with Tukey’s post hoc multiple comparisons test, *p < 0.05, **p < 0.01, ***p < 0.001, ****p < 0.0001. Error bars represent SEM. See also Figure S5.
