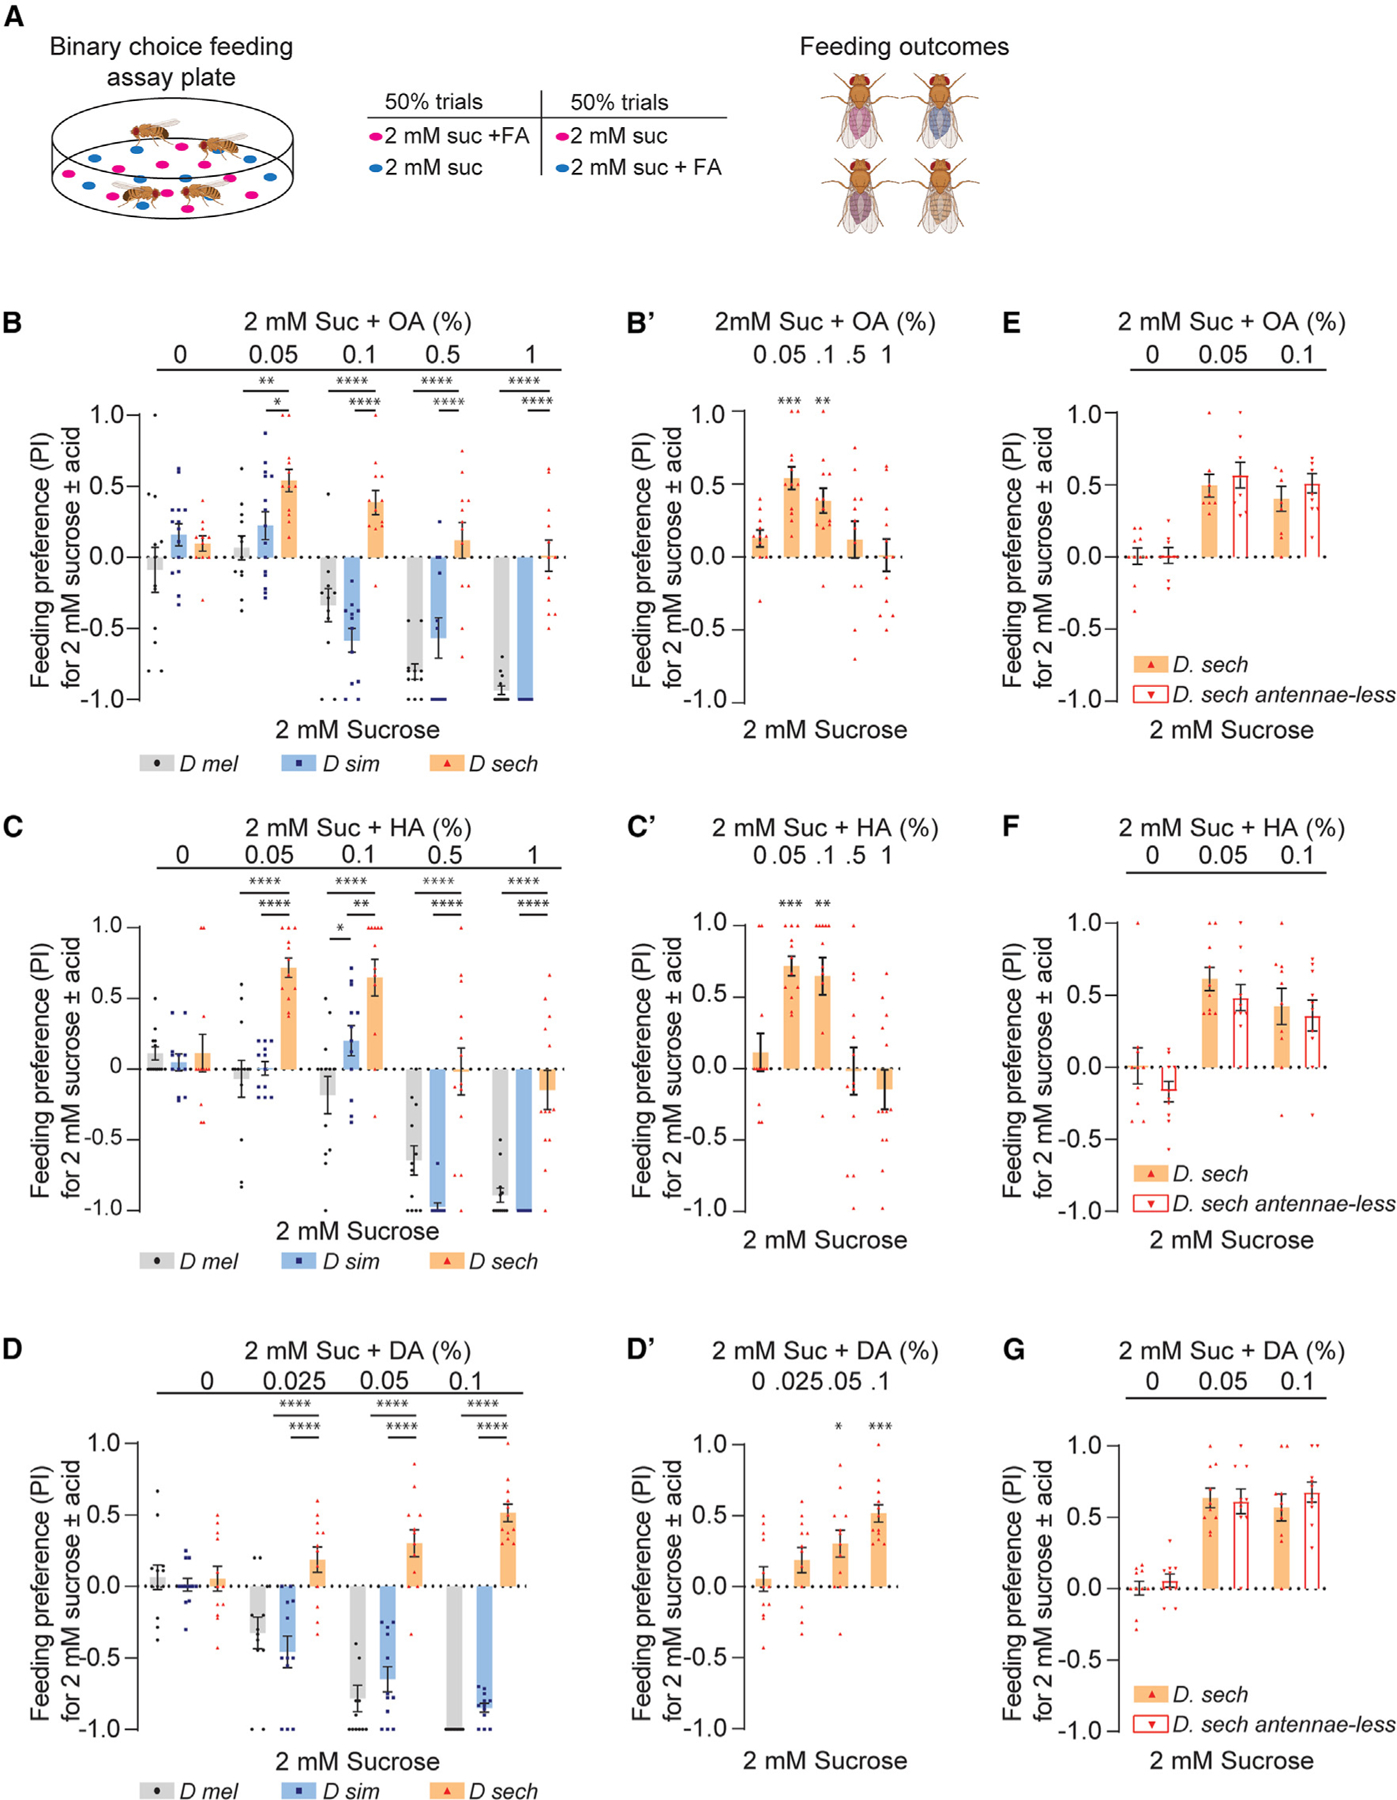
Figure 5. Noni FAs modulate sugar preference in a species-specific manner.

(A) Diagram of binary feeding assay used for (B)–(G) and outcomes. Created with BioRender.com.
(B) Feeding preference of named species to 2 mM sucrose mixed with varying concentrations of octanoic acid (OA) tested against 2 mM sucrose alone. n = 12. (B’) D. sechellia results from (B), with preference index (PI) for each sucrose-OA mixture tested for significance from zero.
(C) Feeding preference of named species to 2 mM sucrose mixed with varying concentrations of hexanoic acid (HA) tested against 2 mM sucrose alone. n = 12. (C’) D. sechellia results from (C), with preference index (PI) for each sucrose-HA mixture tested for significance from zero.
(D) Feeding preference of named species to 2 mM sucrose mixed with varying concentrations of decanoic acid (DA) tested against 2 mM sucrose alone. n = 12.
(D’) D. sechellia results from (D), with preference index (PI) for each sucrose-DA mixture tested for significance from zero.
(E–G) Feeding preference of D. sechellia, tested intact (D sech) or with antennae surgically removed (D sech antennae-less), for 2 mM sucrose mixed with varying concentrations of OA (E), HA (F), or DA (G) tested against 2 mM sucrose alone. n = 9 (OA), n = 10 (HA), n = 10 (DA). Data in (B)–(G) were analyzed using two-way ANOVA with Tukey’s post hoc multiple comparisons test. Data in (B’)–(D’) were tested for significance from hypothetical mean 0 using the Wilcoxon test. For all graphs, *p < 0.05, **p < 0.01, ***p < 0.001, ****p < 0.0001. Error bars represent SEM.
