Figure 1. .
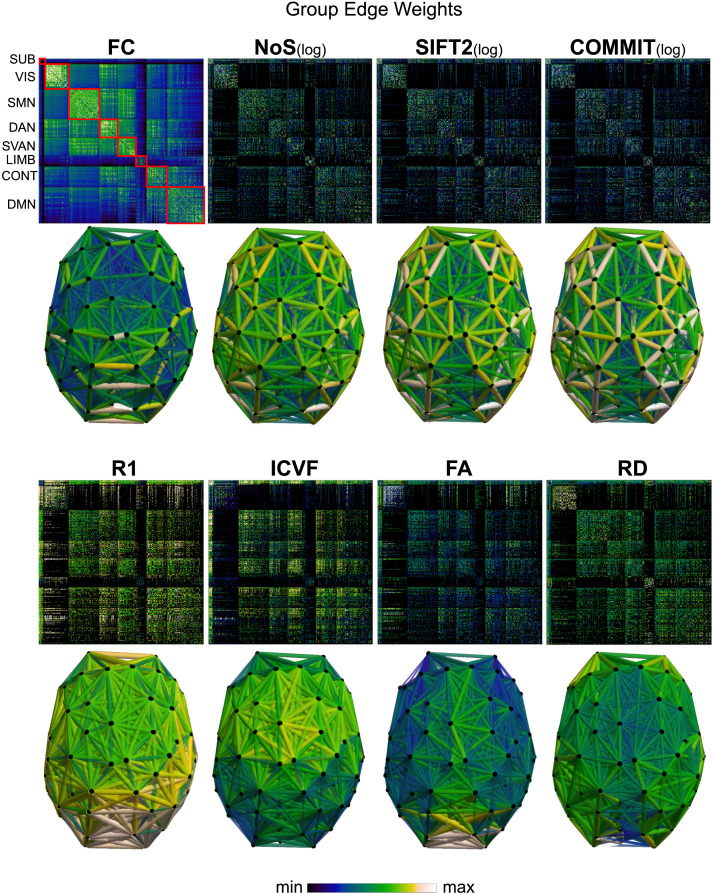
Edge weight spatial distribution. Connectivity matrices of group-level edge weights for FC (functional connectivity), NoS (number of streamlines), SIFT2 (spherical-deconvolution informed filtering of tractograms), COMMIT (convex optimization modeling for microstructure informed tractography), R1 (longitudinal relaxation rate), ICVF (intracellular volume fraction), FA (fractional anisotropy), RD (radial diffusivity), and LoS (mean length of streamlines). Each network is composed of 414 nodes as defined by the Schaefer-400 cortical parcellation and 14 subcortical ROIs. Nodes are grouped into the canonical resting-state modules (Yeo et al., 2011) plus the subcortex: SUB (subcortex), VIS (visual), SMN (somatomotor), DAN (dorsal attention), SVAN (salience ventral attention), LIMB (limbic), CONT (control), and DMN (default mode). 3D cortical surfaces (shown below) of group-level edge weights in the Schaefer-100 parcellation generated with BrainNet Viewer (Xia et al., 2013). Edge diameter and color indicate weight magnitude. The edge weights in NoS, SIFT2, and COMMIT networks were log10 transformed for visualization.

