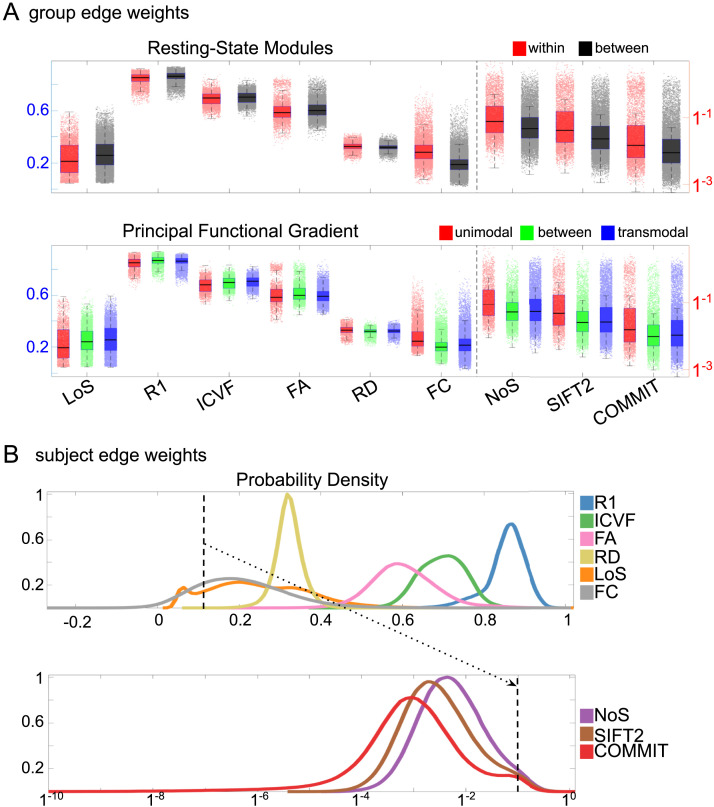
Figure 2. .
Edge weight distribution. (A) Distribution of group-level edge weights binned by (top) within- and between-module; (bottom) unimodal, transmodal, and between. Unimodal is defined as the VIS and SMN modules. Transmodal is defined as the DMN, CONT, DAN, and SVAN modules. (B) Probability density of pooled subject-level edge weight distributions. R1, ICVF, FA, RD, LoS, and FC are shown on a linear x-axis (top), and NoS, SIFT2, and COMMIT are shown on a logarithmic x-axis (bottom). All networks were normalized to the range [0, 1] by dividing by the subject-level max for visualization.

