Figure 3. .
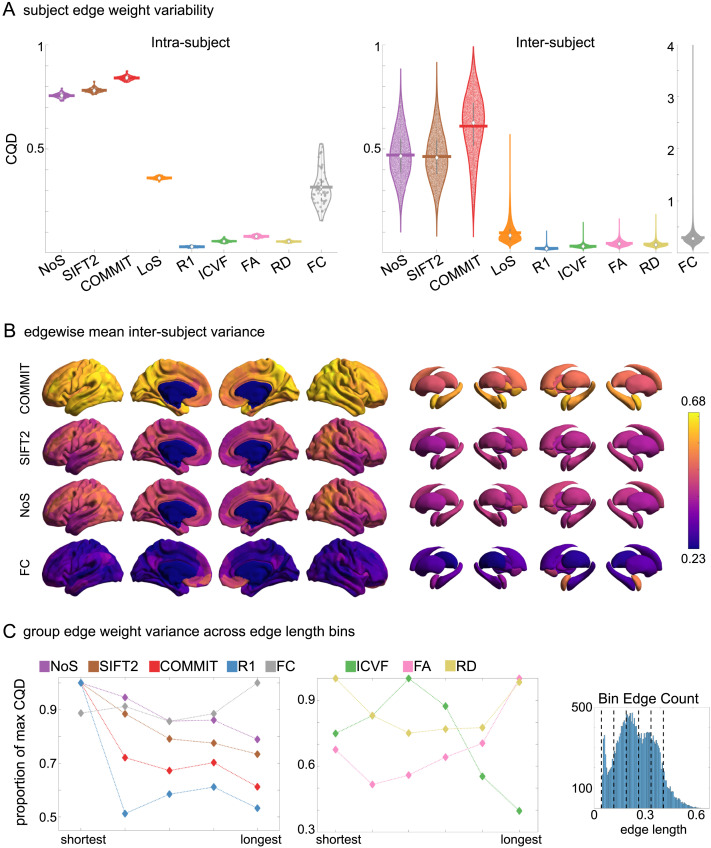
Edge weight variability. Variability is quantified using the coefficient of quartile dispersion (CQD). (A) Violin distributions of intra-subject (left) and inter-subject (right) edge weight variance. Colored data points respectively correspond to individual subjects (N = 50) and edges (N = 8,549). (B) Surface projections of edgewise mean inter-subject variance for cortical nodes in the Schaefer-400 parcellation (left) and 14 subcortical nodes (right). Cortical and subcortical surfaces were respectively generated with BrainSpace (Vos de Wael et al., 2020) and ENIGMA toolboxes (Larivière et al., 2021). (C) The proportion of within-network max CQD is shown across edge length bins for FC, NoS, SIFT2, COMMIT, and R1 (left), as well as ICVF, FA, and RD (middle). Edge weights are grouped into six bins according to edge length, as illustrated by the histogram (right). The edges of bins 1–5 were linearly spaced of width, w. The edges of the final bin were of width 3w.

