Figure 5. .
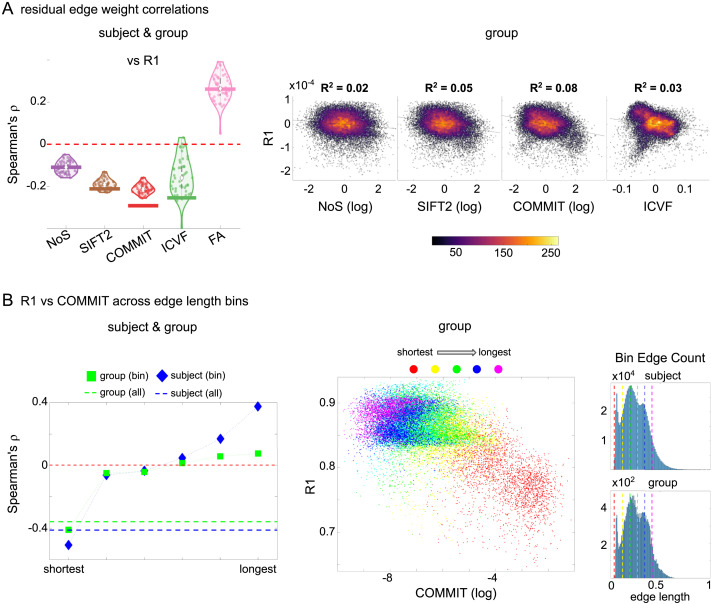
The myelin-dependence of structural brain networks. (A) Violin distributions (left) of edgewise Spearman’s rank correlations with the myelin-weighted network R1. Residual edge weights are compared following linear regression of edge length. Colored data points and bars respectively indicate subject-level and group-level correlations. Heat scatterplots (right) of group-level residual edge weights in R1 as a function of NoS (left), SIFT2 (left middle), COMMIT (right middle), and ICVF (right). The best fit linear curve is shown in black, and R2 (coefficient of determination) is reported. Data color indicates density. Permutation testing provided a one-sided p value of Pperm = 0.000 for all edgewise correlations (Supporting Information Figure S8). (B) Line plot (left) of edgewise Spearman’s rank correlation of edge weights in R1 versus COMMIT across edge length bins. Group-level and subject-level are respectively shown in green and blue. The square and diamond markers connected by dotted lines show binned correlation values, and the horizontal dashed green and blue lines mark the correlation values for all edges pooled together. Scatterplot (middle) of group-level edge weights in R1 as a function of COMMIT with data points colored by bin identity. Histograms (right) illustrating subject- and group-level edge length bins.

