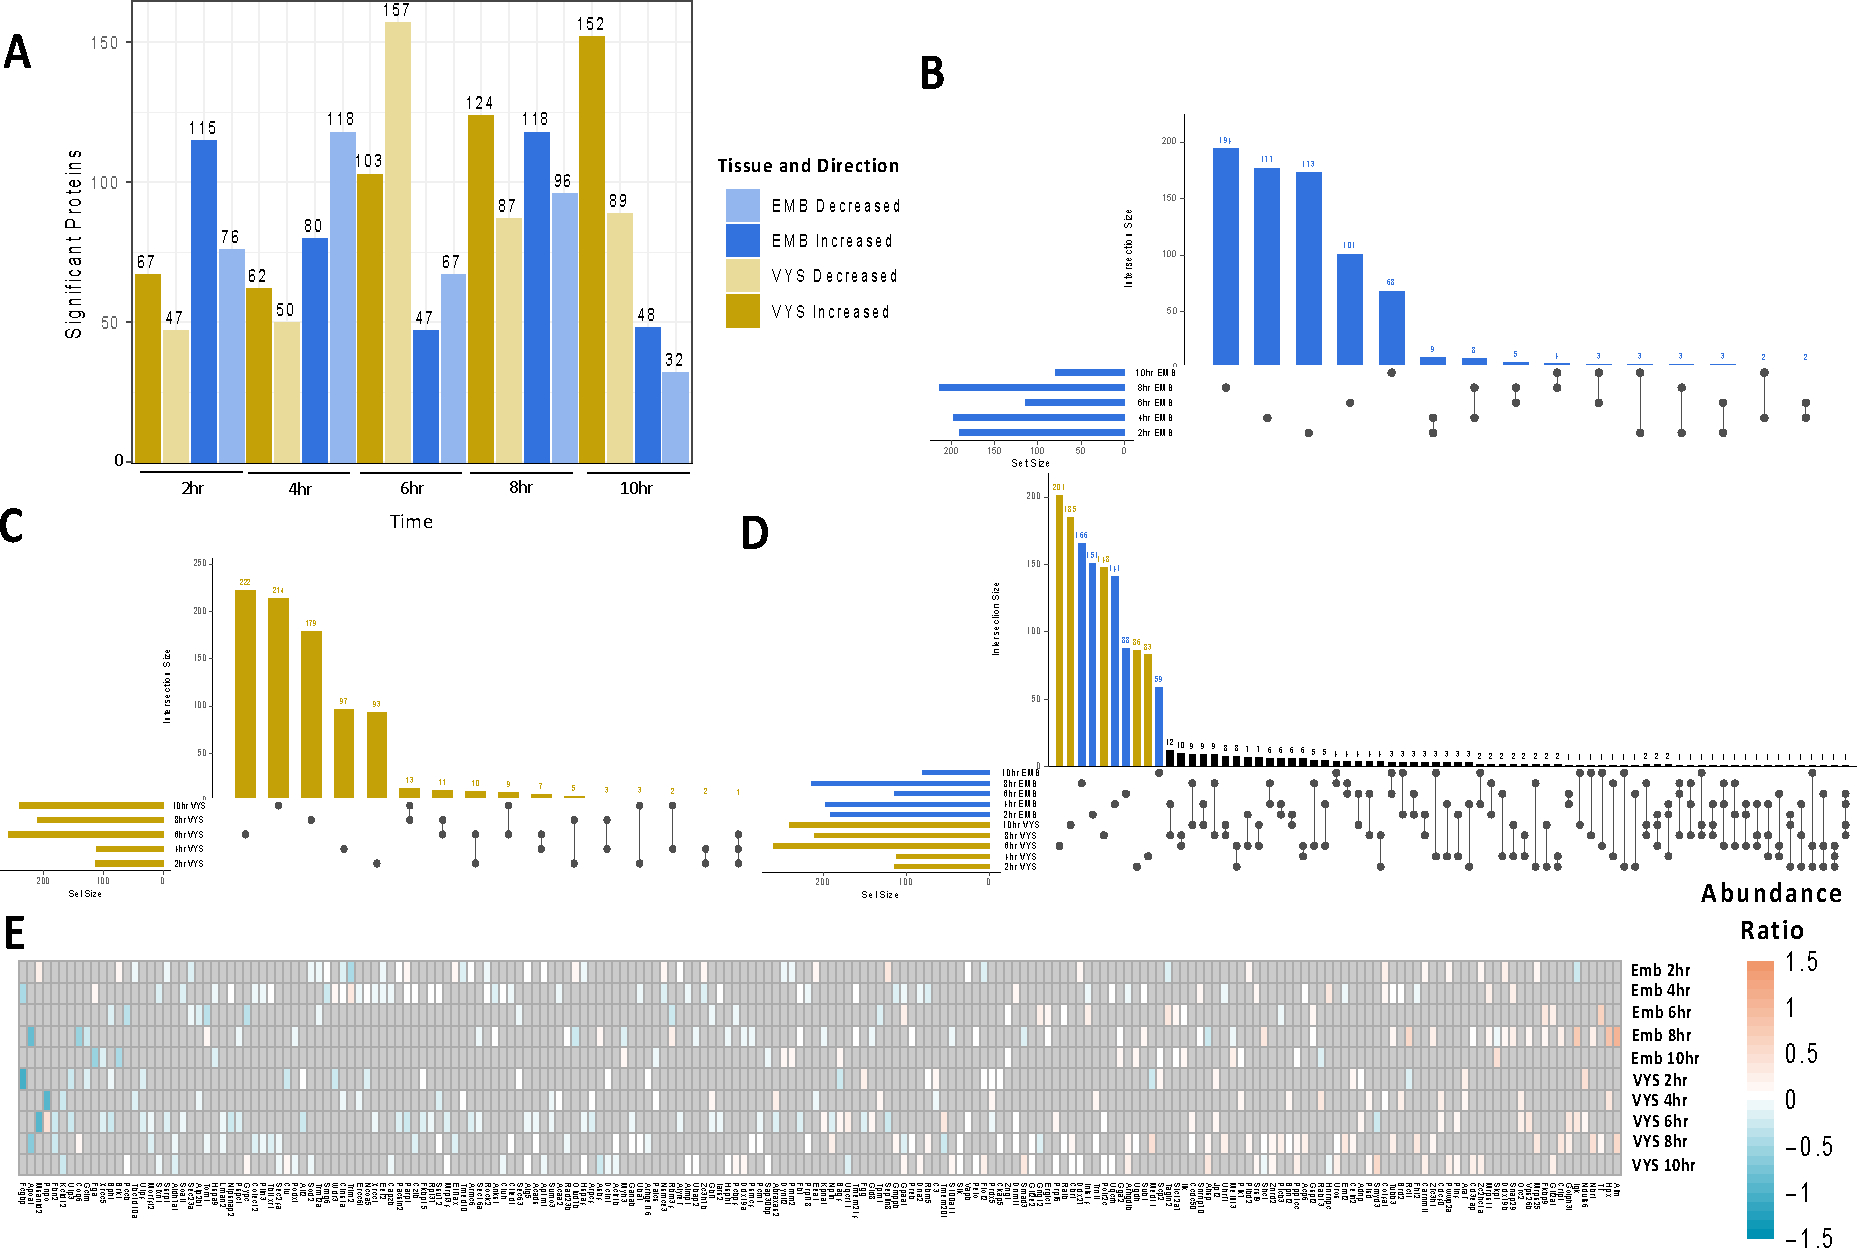
Figure 1:

Summary of significant protein changes in EMB and VYS after 2–10hr treatment with VPA compared to Controls. A) Number of significant proteins (p<0.05) for each tissue and time B) Overlap of significant proteins across time points in the EMB C) Overlap of significant proteins across time points in the VYS D) Overlap of significant proteins across time points in the VYS and EMB. E) Abundance ratio directionality for significant proteins shared by at least 2 tissues or time points. Gray shading indicates a lack of significance for a given protein and treatment group.
