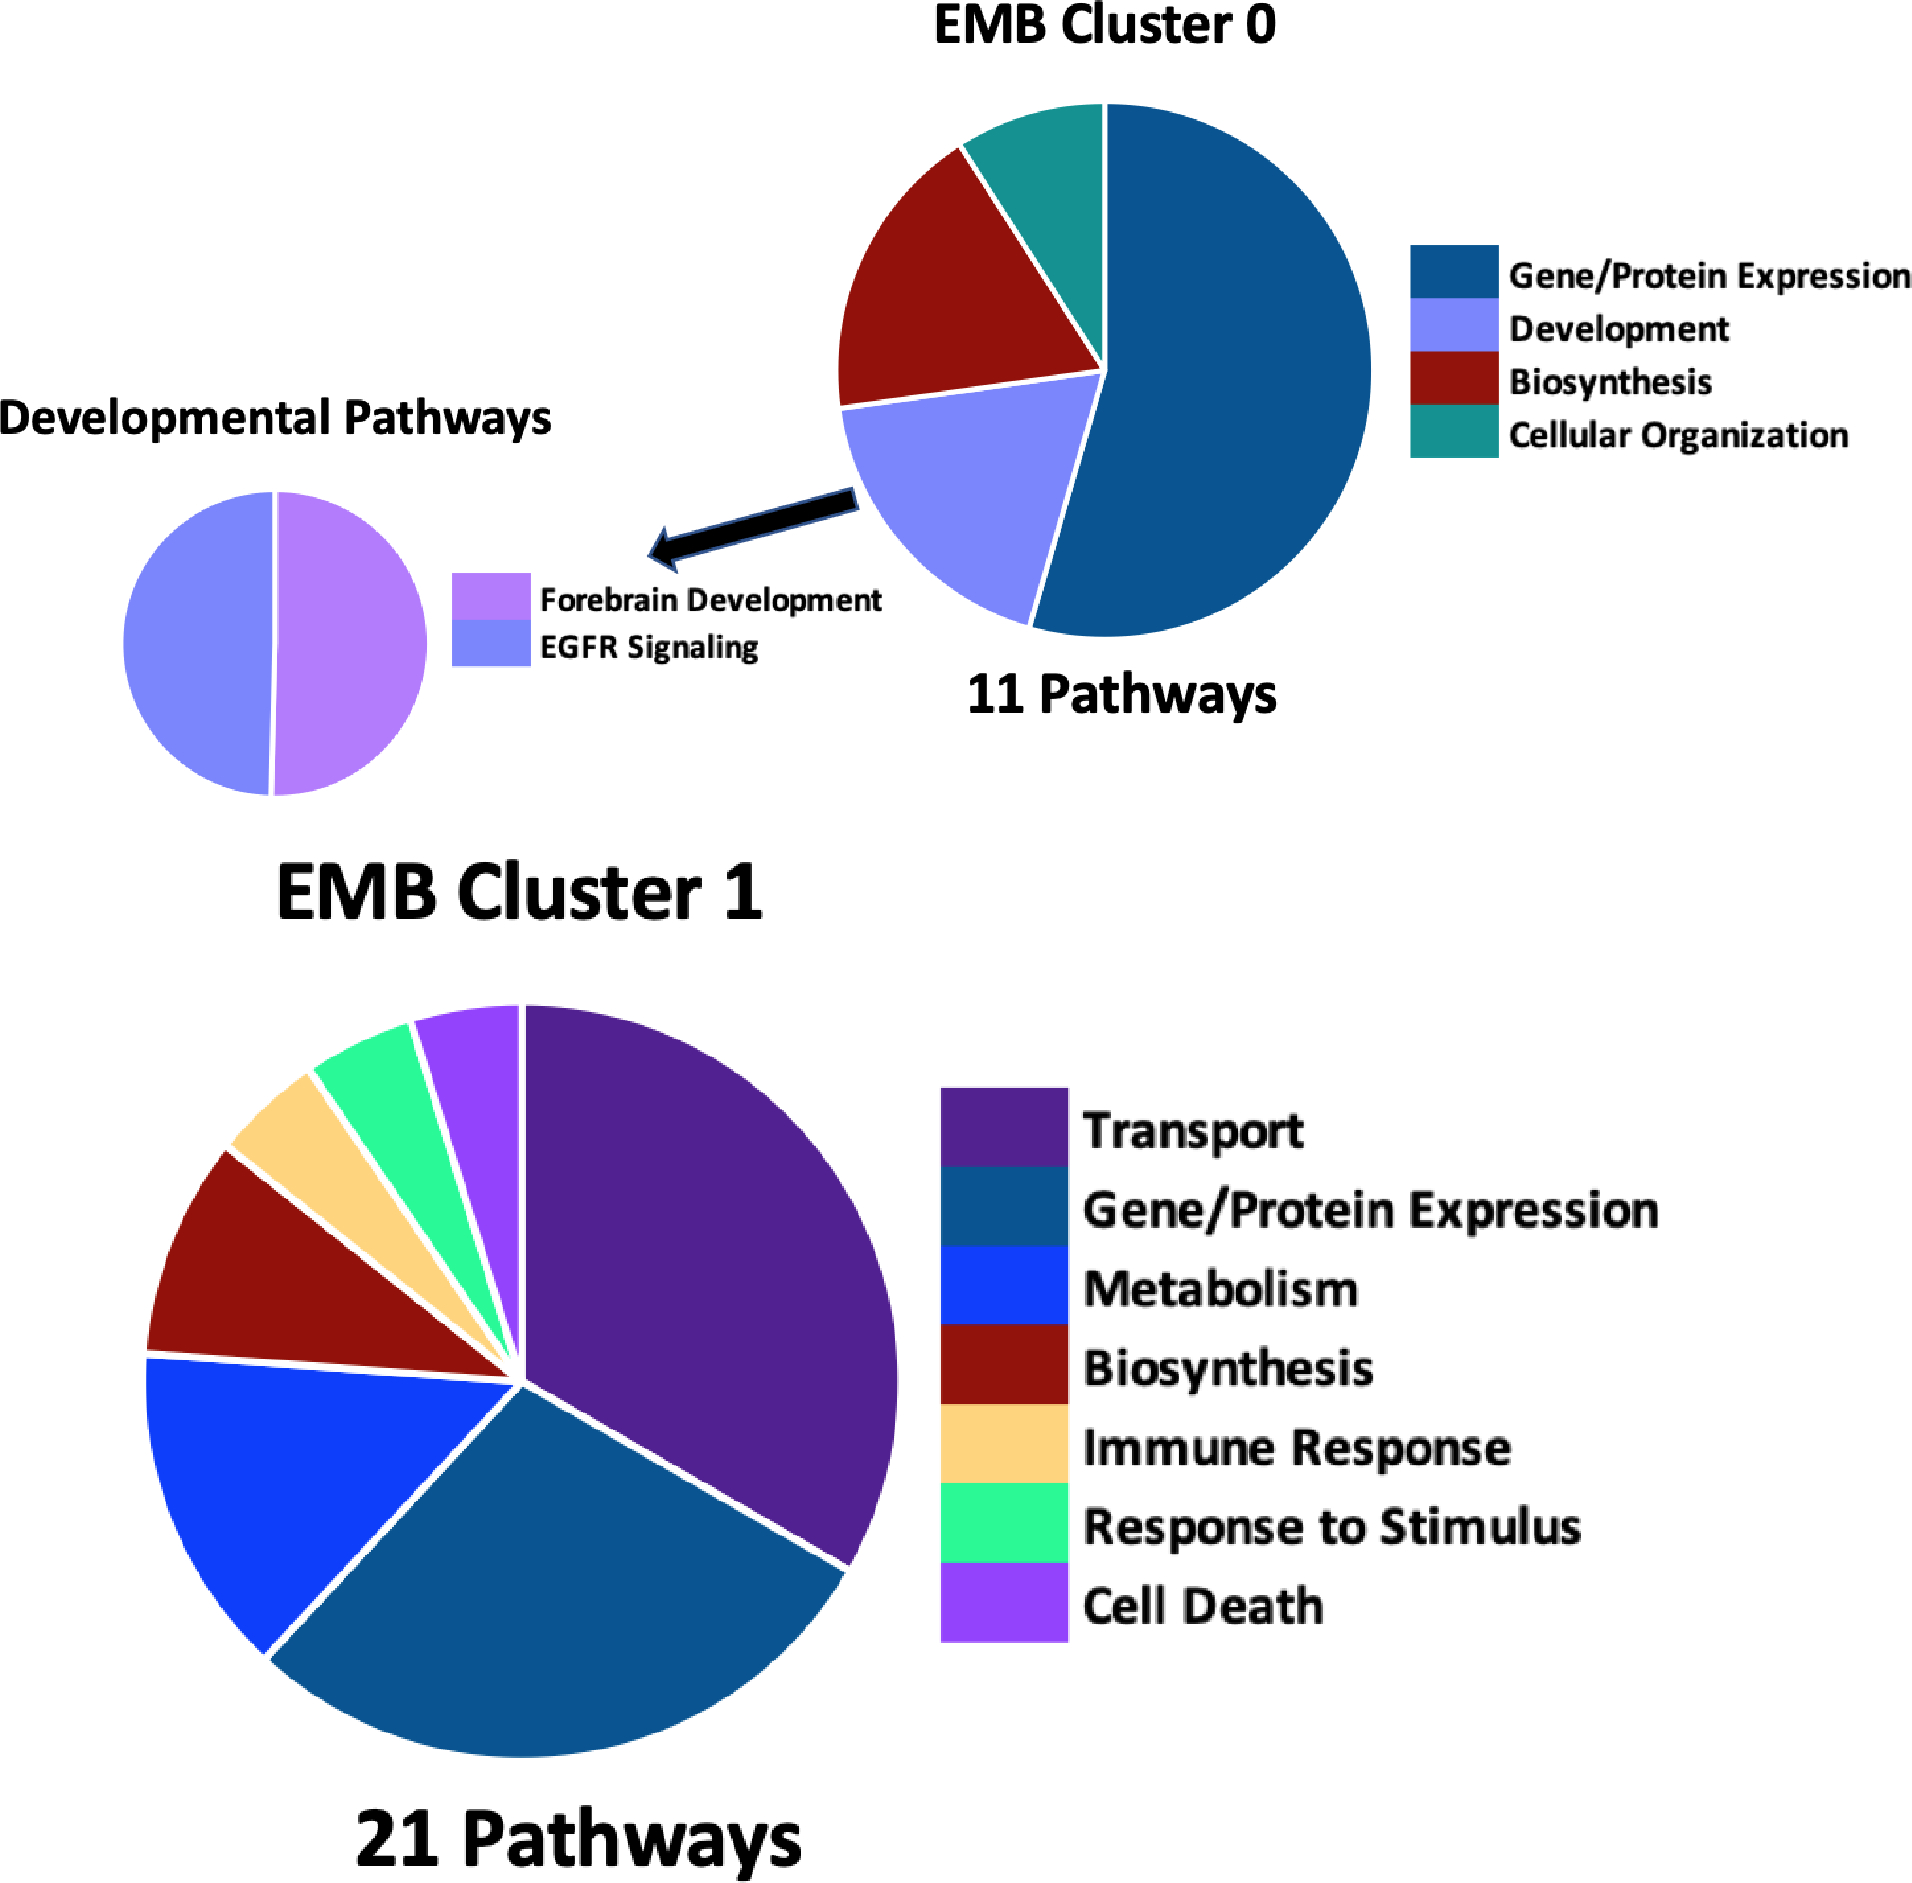
Figure 3:

EMB abundance cluster 0 (A) and cluster 1 (B) biological process GO-term pathway enrichment in DAVID identified 11 and 21 enriched pathways, respectively with a p-value < 0.05 using the full EMB protein list as background. Pie chart division is based on the total number of pathways in each category in the main figure with division based on the pathway’s −log10 p-value in the highlighted developmental pathways. A full list of pathways is available in Supplemental Table 3.
