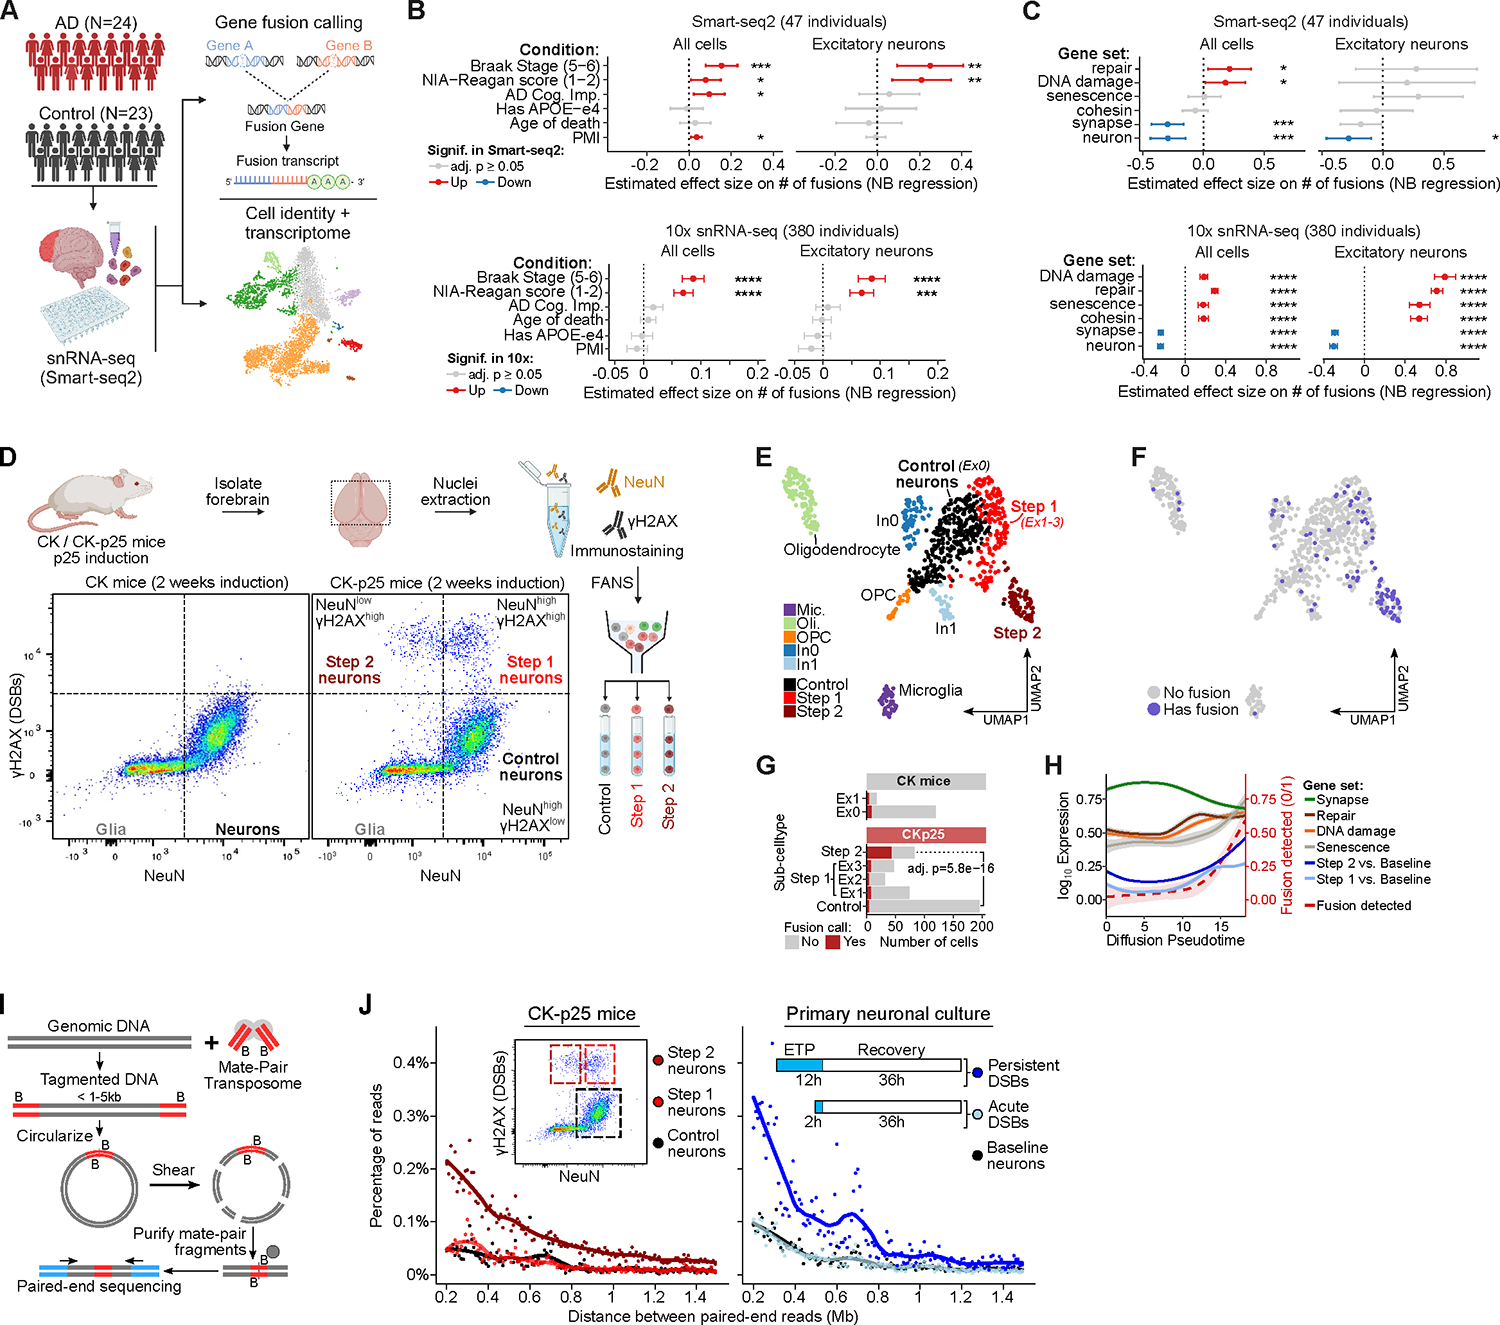
Figure 1: DSBs in neurons lead to mosaic genome structural variations. See also Figure S1, S2 and Table S1, pages 1–6.

A) Schematic of snRNA-seq (Smart-seq2) analysis in human post-mortem brains.
B) The effect size of the number of gene fusions using human snRNA-seq as a function of human sample covariates. Significantly increased (red) or decreased (blue) gene fusions shown for adjusted p-value ≤ 0.05. Human sample covariates include AD cognitive impairment score (AD Cog, Imp) and post-mortem interval (PMI).
C) The effect size of the number of gene fusions as a function of gene sets associated with different Gene Ontology (GO) terms, similar to panel B.
D) Representative FANS dot-plot of CK/CK-p25 forebrain after 2 weeks induction using NeuN (neuron) and γH2AX (DSB) marker.
E) UMAP embedding of CK/CK-p25 snRNA-seq after 1 or 2 weeks of induction. Colors indicate cell-type annotations. Control neurons (Ex0) and Step 1 neurons are represented by clusters Ex1, Ex2, and Ex3.
F) Overlay of cells containing at least 1 gene fusion event (blue) on the snRNA-seq UMAP embedding.
G) Quantification of the number of cells with at least one gene fusion and the total number of cells for Control, Step 1 (Ex1, Ex2, Ex3 clusters), and Step 2. Significance from Fisher’s exact test between Control and Step 2 in CKp25 mice.
H) Trajectory analysis of Control, Step 1, and Step 2. Lines indicate the fraction of cells with gene fusions (dotted red lines) or smoothed expression of gene sets along the pseudo-time trajectory. Step 1 and Step 2 gene sets are defined as significantly upregulated genes from Step 1 vs. Control and Step 2 vs. Control comparisons from bulk RNA-seq (Welch et al.,2022) respectively (adjusted p-value<0.05, log2 fold-change≥1.0).
I) Schematic of mate-pair sequencing. Genomic DNA is tagmented to sizes between 1 – 5 kb with Tn5 transposase carrying biotinylated adaptors. The fragments are circularized and then sheared into 200–300 bp fragments. The ligation junctions are then enriched through biotin pull-down and paired-end sequenced. Mapped read pairs will be separated by 1– 5 kb and large deviations from the expected separation indicates genome structural variation events.
J) Plots of mate-pair sequencing quantifying the percentage of read pairs separated by large genomic distances greater than 200 kb that indicate genome structural variation events.
