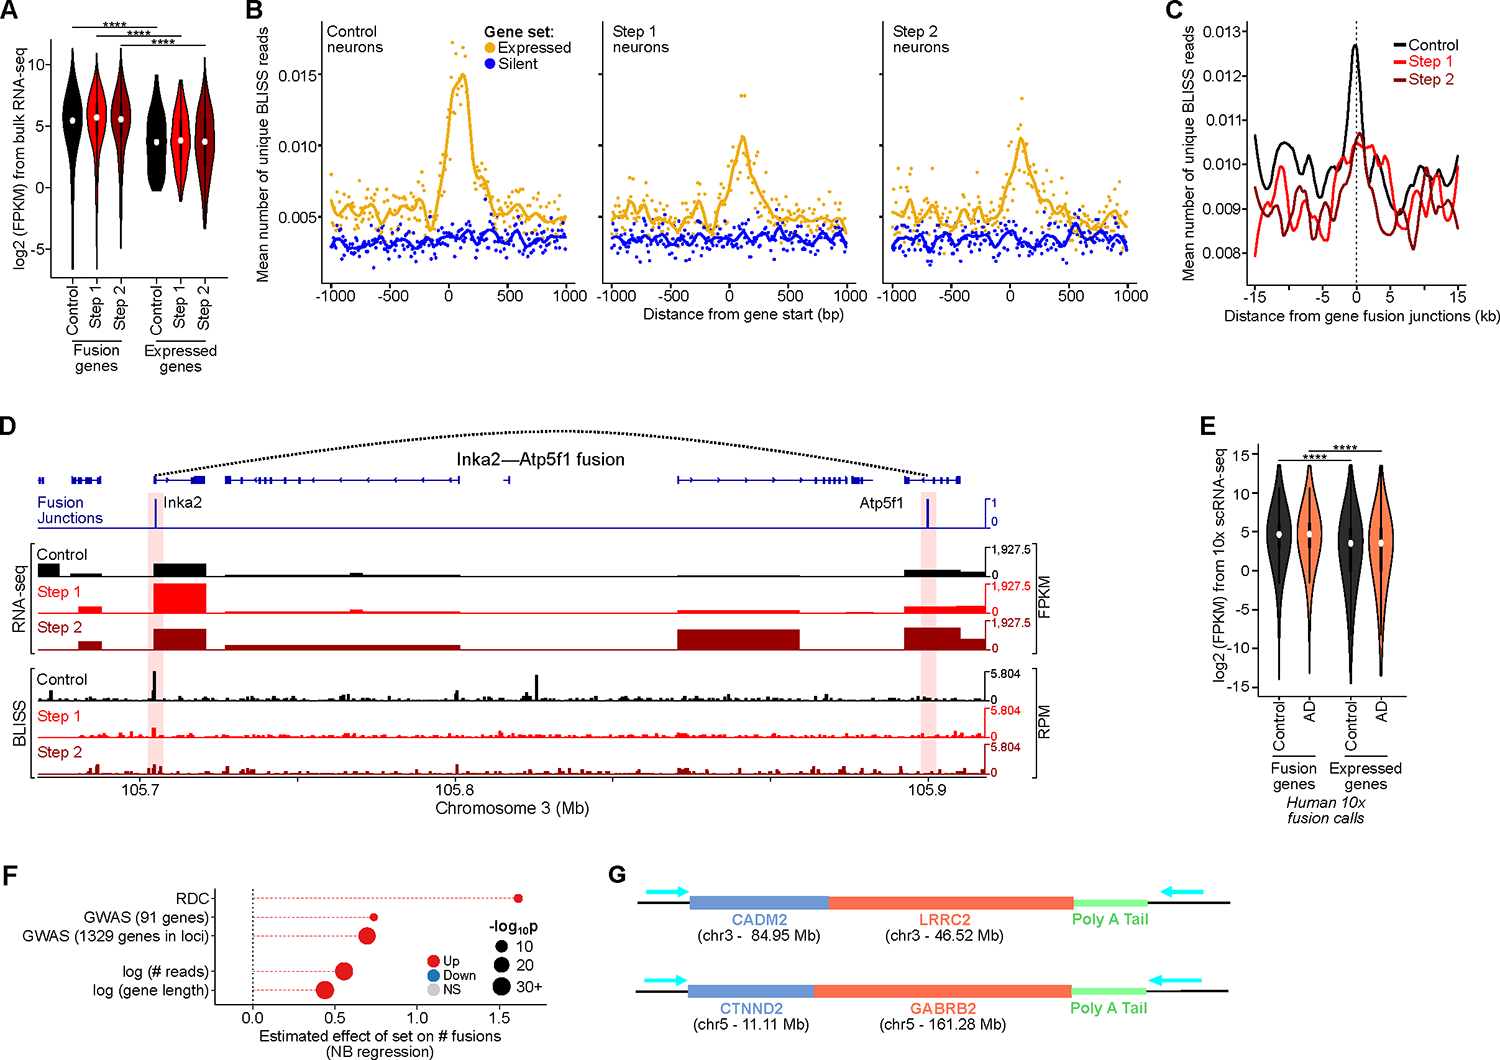
Figure 2: Highly expressed genes and long genes are vulnerable sites for genome structural variations in neurons. See also Figure S3, Table S1, pages 1–4, 6, 7, and 17.

A) Expression level of genes involved in CK-p25 gene fusions (Wilcoxon test with Benjamini–Hochberg correction).
B) Aggregate plots of BLISS reads centered at gene starts for the top 2500 expressed (yellow) and the bottom 2500 silent genes (blue), for Control, Step 1, and Step 2 neurons.
C) Aggregate plots of BLISS reads centered at gene fusion junctions called by snRNA-seq in CK-p25 neurons.
D) Genome browser snapshot of example gene fusion in CK-p25 mice Step 2 neurons. Panels show fusion junctions (top), bulk RNA-seq signal (panels 2–4), and BLISS in the three populations (panels 5–7).
E) Expression level of genes involved in human gene fusions (10x snRNA-seq) vs all expressed genes (Wilcoxon test with BH correction).
F) Effect size of the number of gene fusions as a function of: genes identified as RDC gene, AD GWAS genes, gene expression level (reads), and gene length (bp).
G) Schematics of example gene fusions identified through ONT long-read cDNA sequencing.
