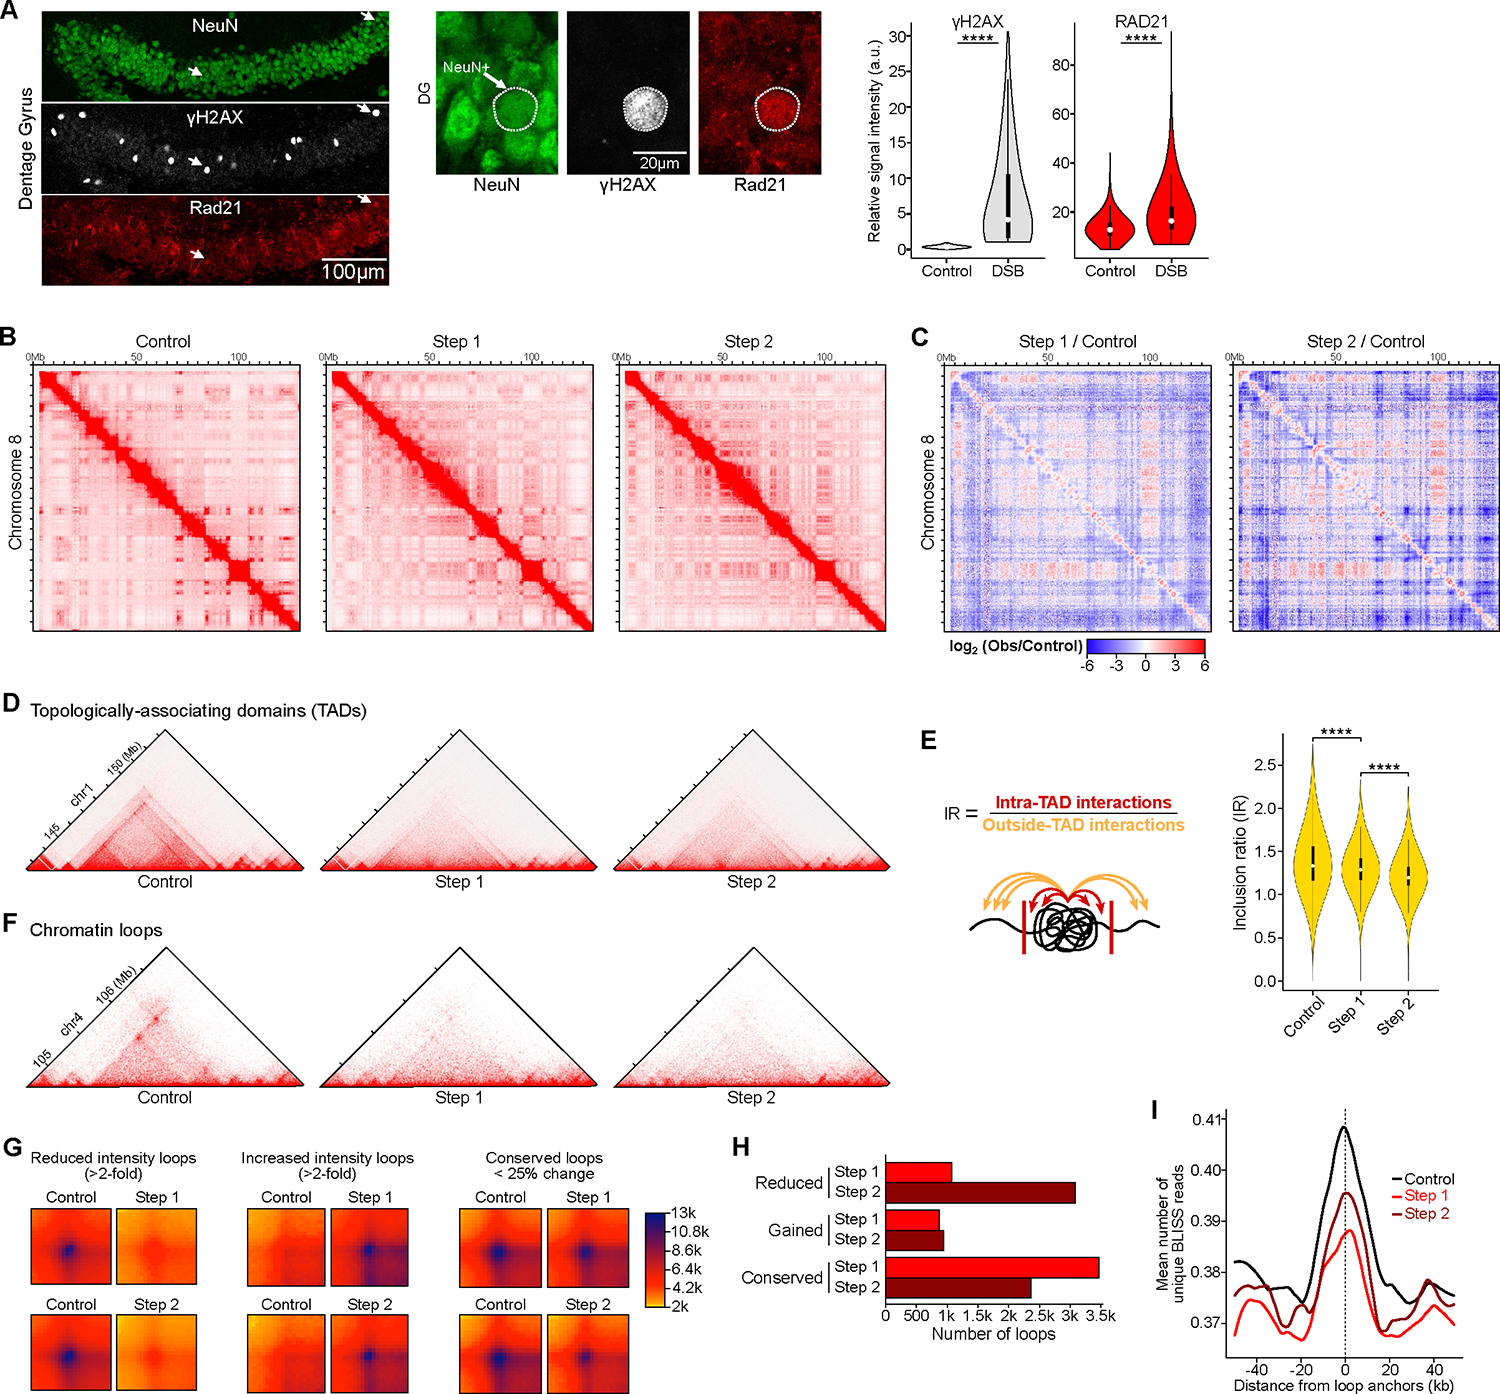
Figure 3: Neurons burdened with DSBs exhibit global disruption of the 3D genome organization at multiple scales. See also Figure S4, Table S1, pages 8–10 and 16.

A) Representative immunohistochemistry images and quantification of RAD21 (cohesin subunit) in 2-week induced CK-p25 mice, comparing neurons with baseline DSBs to neurons enriched for DSBs. Representative images show dentate gyrus (left) and higher-magnification images (right). Violin plots quantify RAD21 levels between neuronal nuclei with baseline DSBs (ϒH2AX relative intensity < 1) and neurons enriched for DSBs (ϒH2AX relative intensity > 1) (Wilcoxon test). The mean relative intensity of ϒH2AX (gray) and RAD21 (red) was measured within NeuN surfaces. Control (n=5,316 cells), DSB (n=725 cells).
B) Full chromosome (chr8) Hi-C chromatin interaction heatmaps.
C) Differential heatmaps comparing Step 1/Control and Step 2/Control, colored by increased (red) or decreased (blue) interactions over control.
D) Representative Hi-C interaction plots showing the disruption of TADs. Hi-C heatmaps were rotated 45 degrees and only the upper triangle is shown.
E) Quantification of TAD disruption through Inclusion Ratio (IR). IR is the ratio of intra-TAD interactions to outside-TAD interactions (Wilcoxon test with BH correction).
F) Representative Hi-C interaction plots showing the disruption of chromatin loops.
G) Aggregate heatmaps of reduced intensity (>2-fold), increased intensity (>2-fold), and conserved (<25% change) chromatin loops for Step 1 vs. Control and Step 2 vs. Control.
H) Bar plot indicating quantification of chromatin loop disruption in Step 1 (red) and Step 2 (dark red).
I) Aggregate plots of BLISS reads centered at loop anchors in CK-p25 neurons.
