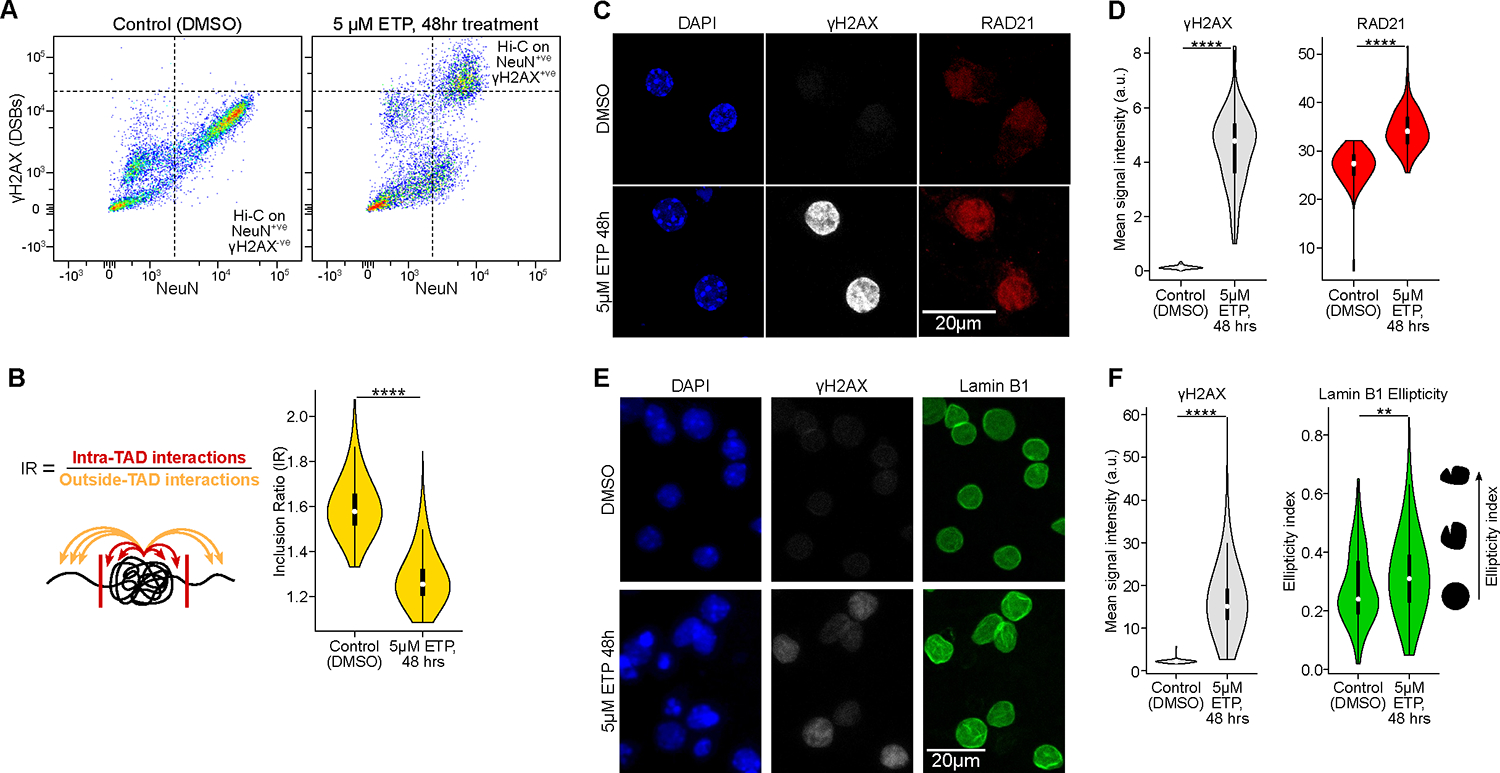
Figure 4: DSBs in neurons are sufficient to disrupt the 3D genome organization. See also Figures S5, Table S1, page 11 and 16.

A) FANS dot-plots of NeuN versus ϒH2AX immunoreactivity after etoposide (5μM for 48 hours) or vehicle (DMSO) treatment in primary neuronal culture.
B) Quantification of TAD disruption (IR, Wilcoxon test).
C) Representative images and quantification of RAD21 (cohesin subunit) IHC in primary culture neurons (DIV 12) after Etoposide (5μM for 48 hours) or vehicle treatment (DMSO).
D) Violin plots quantifying the images for ϒH2AX levels (gray) and RAD21 levels (red) in control neurons and etoposide-treated neurons (Wilcoxon test). The mean relative intensity of ϒH2AX and RAD21 was measured within NeuN surfaces. Control (n=111 cells), ETP (n=112 cells).
E) Representative images of Lamin B1 IHC in primary culture neurons (DIV 12) after Etoposide (5μM for 48 hours) or vehicle treatment (DMSO).
F) Violin plots quantifying the images for ϒH2AX levels (red) and Lamin B1 ellipticity (green) in control neurons and etoposide-treated neurons (Wilcoxon test). The mean relative intensity of ϒH2AX was measured within Lamin B1 surfaces that were positive for NeuN. Control (n=78), ETP (n=809).
