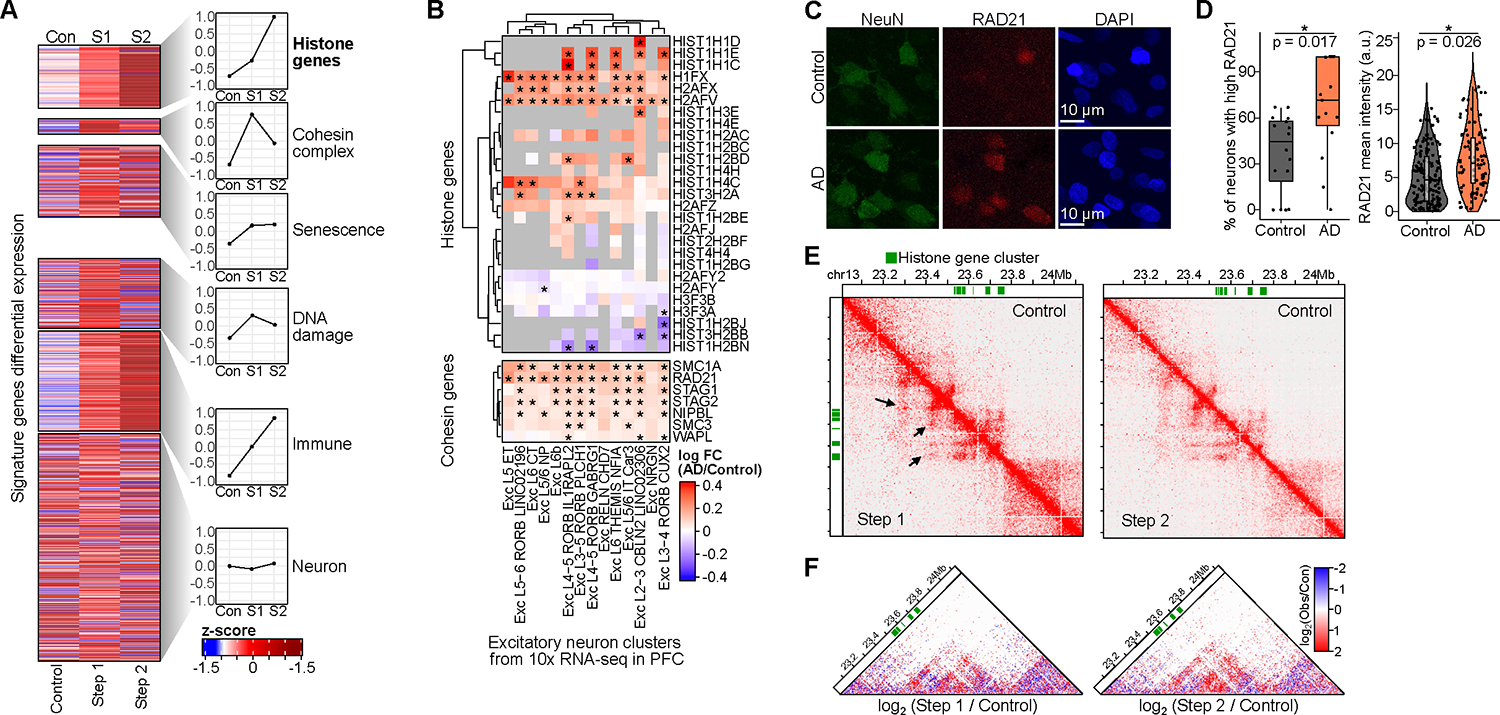
Figure 6: Up-regulation of cohesin and histone genes in Alzheimer’s Disease. See also Figure S6 and Table S1, page 5, 15, and 16.

A) Heatmap of differential gene expression as z-scores from bulk RNA-seq in Control, Step 1, and Step 2 for signature gene sets. The right panels show average values for each set.
B) Heatmap of differential expression of histone and cohesin genes across excitatory subtypes in 10x snRNA-seq from Mathys et al. (*differential).
C) Representative immunostaining images of RAD21 in AD and Control human post-mortem tissue.
D) RAD21 staining was quantified as the percentage of neurons with high RAD21 (mean intensity > 50th percentile) per image (left) or using RAD21 mean intensity (right). Significance was calculated using a linear mixed-model approach across 3 AD and 3 Control individuals (Table S15).
E) Hi-C interaction matrix for histone gene cluster (green blocks, chr13). The lower diagonal is Step 1 or 2, upper is Control.
F) Differential Hi-C heatmaps comparing Step 1/Control and Step 2/Control, colored by increased (red) or decreased (blue) interactions over control. Hi-C heatmaps were rotated 45 degrees and only the upper triangle is shown.
