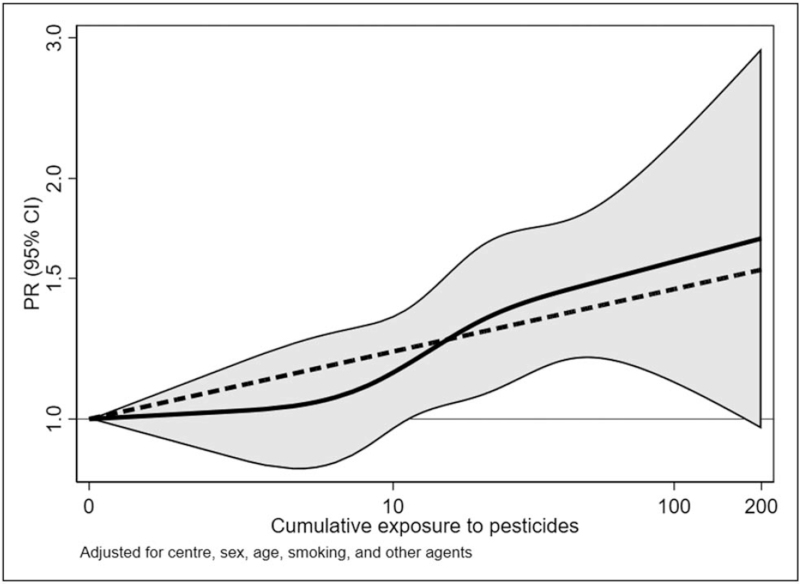
FIGURE 2.
Association between fully adjusted prevalence ratios of chronic obstructive pulmonary disease and cumulative exposure to pesticides (EU-years, ln-transformed) using restricted cubic splines (knots at 25th, 50th, 75th, and 90th percentiles of cumulative exposure among exposed, ln-transformed), in the UK Biobank study, 2006–2010, UK. The continuous curves are prevalence ratios and 95% confidence bands; the dashed line shows the log-linear relationship prevalence ratios = 1.08 per ln(EU-years). ln, natural logarithm [5▪▪].

