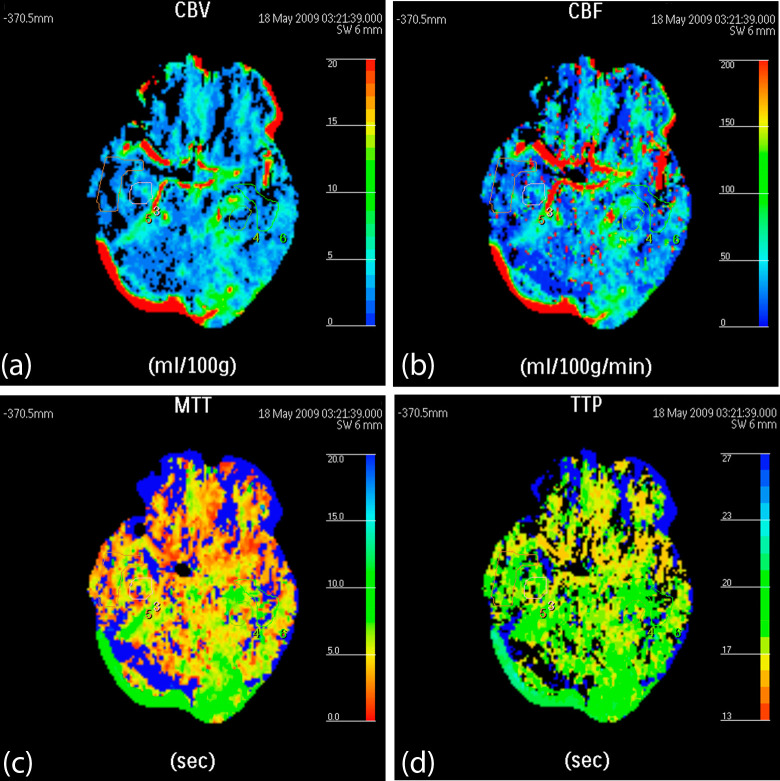
Figure 2.
False-color pictures of a 72-year-old male with the diagnosis of moderate Alzheimer’s disease (AD) at the hippocampus level (A, the cerebral blood volume [CBV] map: the CBVs of the bilateral temporal cortex and hippocampus are lower and therefore are presented in blue; B, the cerebral blood flow [CBF] map: the CBFs of the bilateral temporal cortex and hippocampus are lower and therefore are presented in a deeper color than the healthy participants [Figure 1B]; C, the mean transit time [MTT] map: the bilateral temporal cortex and hippocampus are presented in yellow and green, which means the MTT is longer than that of healthy participants [Figure 1C]; D, the time to peak [TTP] map: the bilateral temporal cortex and hippocampus are presented in yellow, green and blue). The red component value of the TTP is higher than that of healthy participants (Figure 1D), reflecting a longer TTP in patients with AD than in healthy participants.

