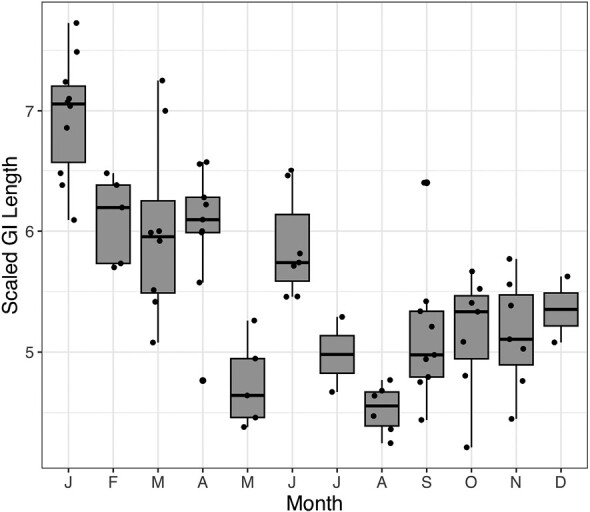
Fig. 3.

Boxplots of Peromyscus maniculatus scaled gastrointestinal tract length by month. Each boxplot reflects the median (center line), first and third quartile (box edges), and ±1.58 time the interquartile range (whiskers).

Boxplots of Peromyscus maniculatus scaled gastrointestinal tract length by month. Each boxplot reflects the median (center line), first and third quartile (box edges), and ±1.58 time the interquartile range (whiskers).