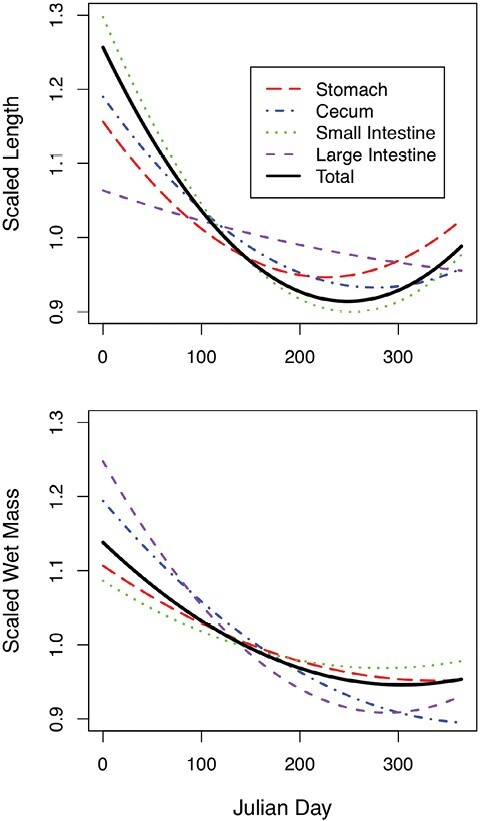
Fig. 5.

Top-ranking polynomial regressions of scaled length (top) and wet mass (bottom) of four gastrointestinal tract sections. Regressions were evaluated for each section (stomach, small and large intestines, and cecum) and the total scaled gastrointestinal length. Each regression was scaled by the mean value of each section.
