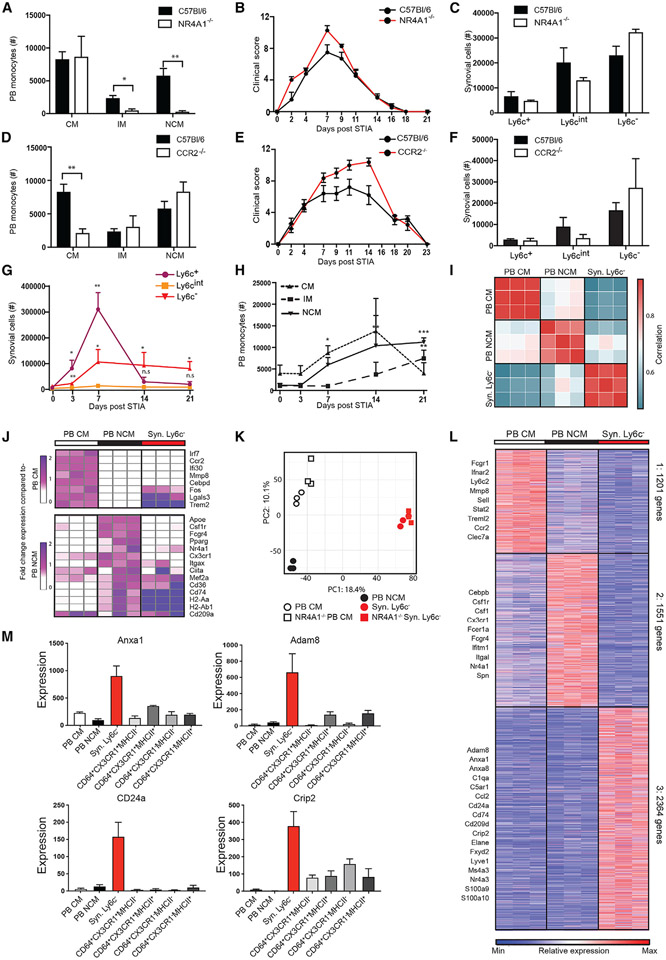
Figure 1. Synovial Ly6c− cells are distinct from circulating NCMs.
(A–F) Classical (CM), intermediate (IM), and non-classical (NCM) monocytes in the peripheral blood (PB); (B) STIA severity; and (C) Syn Ly6c+, Ly6cint, and Ly6c− in C57BL/6 compared with NR4A1−/− synovium and (D–F) compared with CCR2−/−.
(G and H) Changes in numbers of (G) Syn Ly6c+, Ly6cint, and Ly6c− and (H) PB CMs, IMs, and NCMs during STIA. Data shown are n ≥ 4 ± SEM, *p < 0.05, **p < 0.01, ***p < 0.001.
(I) Pairwise Pearson’s correlation of global gene expression between replicates of PB CMs, PB NCMs, and Syn Ly6c−.
(J) Fold-change expression of monocyte-associated genes from Mildner et al. compared with PB CMs or NCMs.4
(K) Principal component analysis (PCA) of 10,206 genes expressed by PB CMs, PB NCMs, and Syn Ly6c− from C57BL/6 and NR4A1−/− mice.
(L) k-means clustering of 5,115 differentially expressed genes across PB CMs, PB NCMs, and Syn Ly6c− cells.
(M) Mean expression of representative genes from PB CMs, PB NCMs, Syn Ly6c−, and Syn macrophage (Syn Mac) populations (RNA-seq data: n = 3, error bars indicate SEM).

