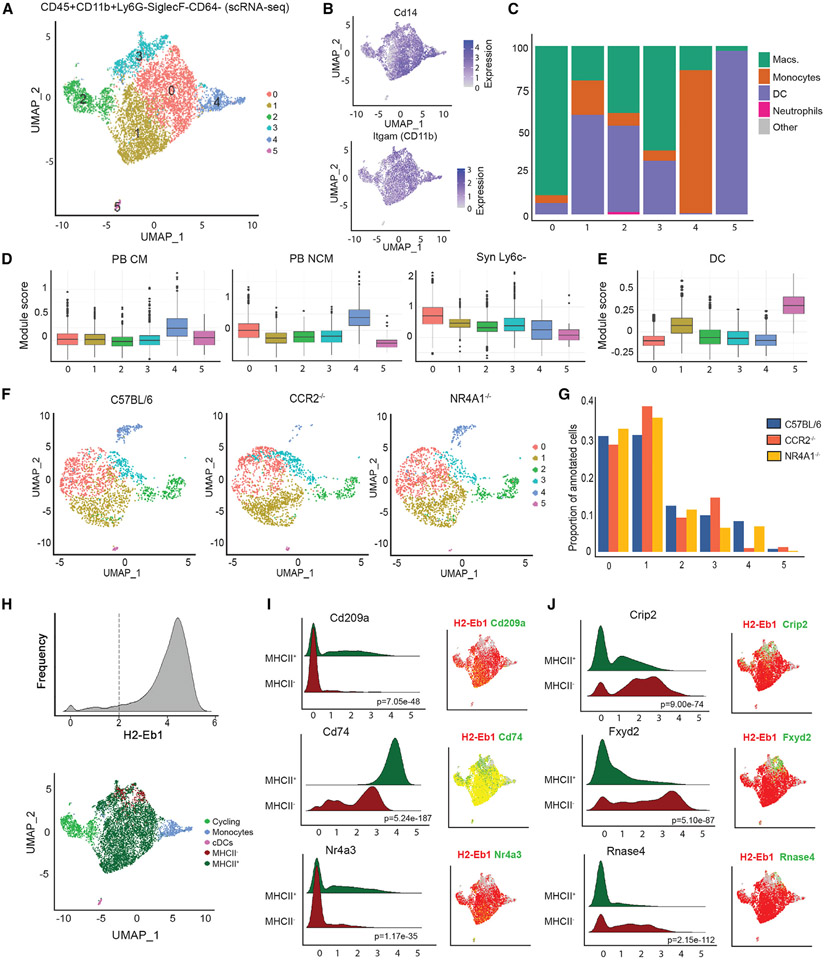
Figure 2. scRNA-seq analysis of joint myeloid niche identifies tissue Syn Ly6c− cells.
(A) Uniform manifold approximation and projection (UMAP) depicting six subpopulations of total Ly6c− (CD45+CD11b+Ly6G−SiglecF−CD64−Ly6c−) cells from scRNA-seq data.
(B) Expression of myeloid markers Cd14 and Itgam.
(C) Percentage of cells assigned to ImmGen cell types by singleR.
(D and E) Module score for scRNA-seq subpopulations representing expression of key genes in (D) PB CMs, PB NCMs, Syn Ly6c−, and (E) conventional dendritic cell (cDCs).
(F) Integration of scRNA-seq data on total Ly6c− (CD45+CD11b+Ly6G−SiglecF−CD64−Ly6c−) cells from CCR2−/− and NR4A1−/− mice with C57BL/6 (subsampled to 2,000 cells).
(G) Proportion of cells annotated as each subpopulation in C57BL/6, CCR2−/−, and NR4A1−/− mice.
(H) Reclassification of cluster 2 as cycling cells, cluster 4 as monocytes, cluster 5 as cDCs, and clusters 0, 1, and 3 as MHCII+ or MHCII− based on expression of H2-eb1.
(I and J) Ridge plots and UMAP visualization of gene expression by MHCII compartment. The p value by Wilcoxon test is indicated.

