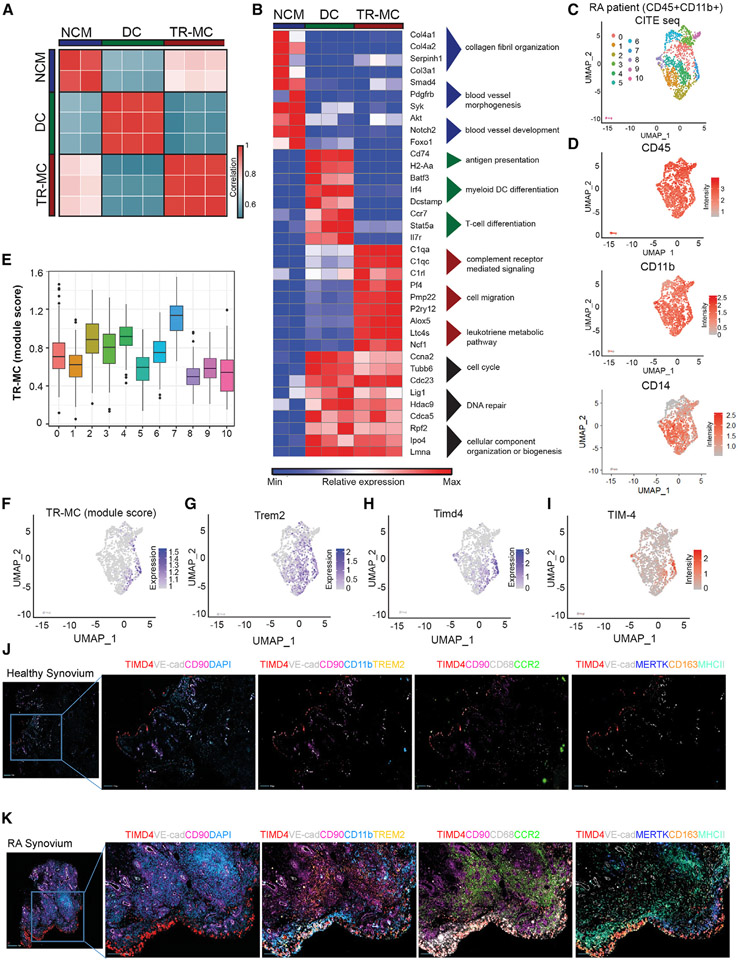
Figure 4. Extravascular tissue location confers phenotype of TR-MCs.
(A) Pairwise Pearson’s correlation of global gene expression between replicates of NCMs, DCs, and TR-MCs.
(B) Relative expression of representative genes from gene ontology (GO) processes associated with NCMs, DCs, and TR-MCs.
(C) Clustering of RA patient CD45+CD11b+ synovial cells based on gene expression from CITE-seq.
(D) ADT intensity of CD45, CD11b, and CD14 on RA patient synovial cells.
(E and F) TR-MC module score in RA patient data.
(G and H) Expression of Trem2 and Timd4 in RA patient data.
(I–K) (I) ADT intensity of TIM4 in RA patient data. Immunofluorescence staining of synovial tissue from (J) healthy control and (K) RA patient.

