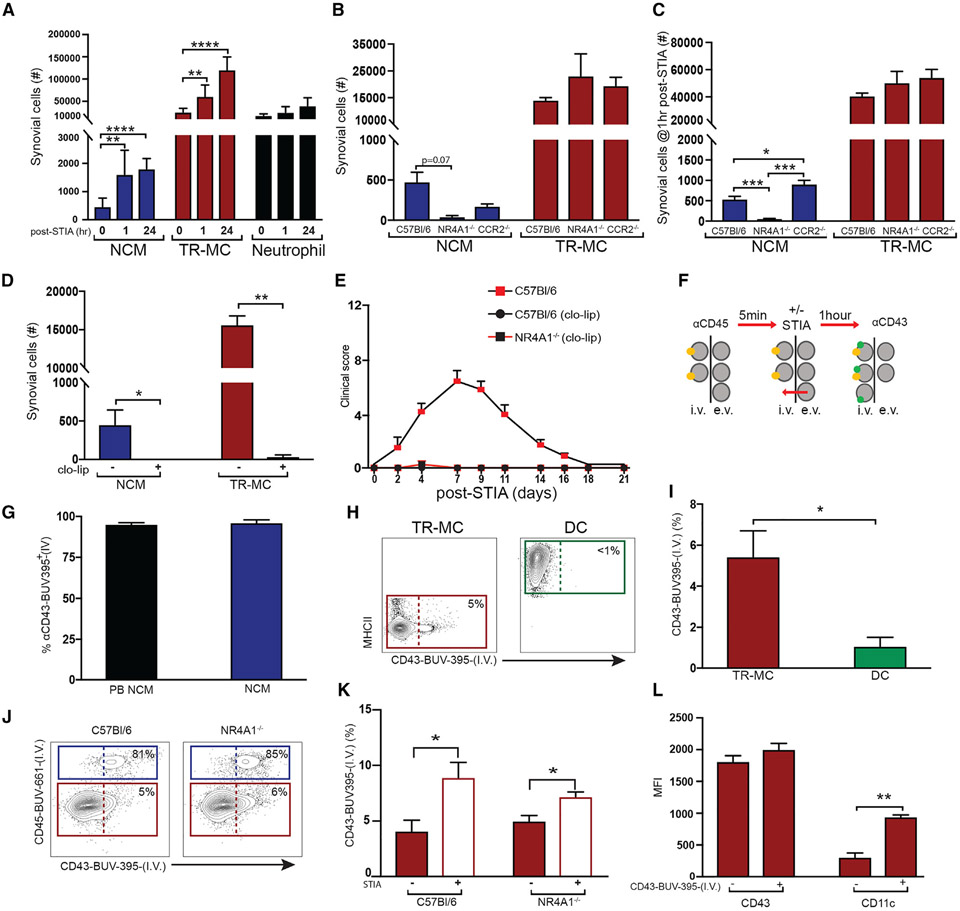
Figure 6. TR-MCs are the critical population for development of inflammatory arthritis.
(A) NCMs, TR-MCs, and neutrophils at 1 and 24 h post-STIA.
(B and C) NCMs and TR-MCs (B) at steady state and (C) at 1 h post-STIA in C57BL/6, NR4A1−/−, and CCR2−/− mice.
(D) Depletion of NCMs and TR-MCs following 200 μL of clo-lip.
(E) STIA severity induced 24 h after clo-lip treatment in C57BL/6 and NR4A1−/− mice.
(F) Antibody labeling system.
(G) Labeling of PB and NCM via I.V. administration of anti-CD43.
(H and I) Labeling of TR-MCs and DCs with I.V. anti-CD43 after 1 h of steady state.
(J and K) Labeling of NCMs and TR-MCs with anti-CD43 in C57BL/6 and NR4A1−/− (J) after 1 h of steady state and (K) 1 h after STIA.
(L) Surface expression of CD43 and CD11c on I.V. αCD43-BUV395+/− TR-MCs. Graphs are mean n > 4 + SEM; p-value was calculated with unpaired t test; *p < 0.05, **p < 0.01, ***p < 0.005, ****p < 0.001.

