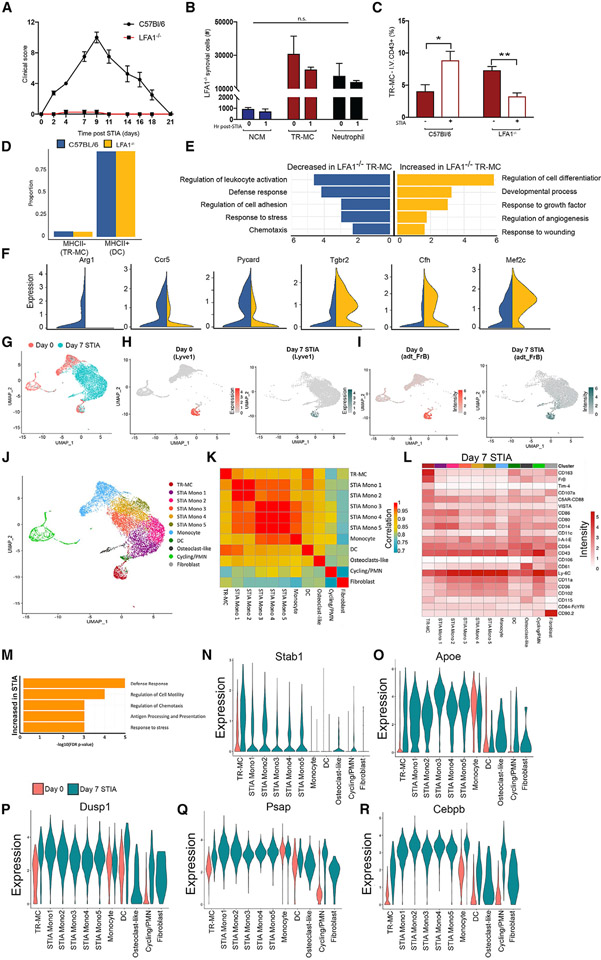
Figure 7. Deletion of LFA1 reduced the pro-inflammatory phenotype of TR-MCs.
(A) STIA clinical score in C57BL/6 and LFA1−/− mice.
(B) NCMs, TR-MCs, and neutrophils 1 h post-STIA in C57BL/6 and LFA1−/− mice.
(C) TR-MCs labeled with I.V. αCD43-BUV395 at steady state and 1 h post-STIA. Graphs are mean n > 4 + SEM; p value was calculated with unpaired t test; *p < 0.05, **p < 0.01.
(D) Ratio of cells annotated as either MHCII− (TR-MCs) or MHCII+ (DCs) in C57BL/6 and LFA1−/− mice.
(E) Selected GO processes associated with differentially expressed genes in the MHCII− compartment (representing TR-MCs) between LFA1−/− and C57BL/6 mice.
(F) Expression of representative genes increased or decreased in MHCII− cells from LFA1−/− compared with C57BL/6 mice.
(G) Merged CITE-seq data on CD45+CD11b+Ly6G−SiglecF−CD64−MHCII− cells from D0 (shown in Figure 3) and D7 STIA.
(H) Expression of Lyve1 (TR-MC marker) in D0 and D7 STIA.
(I) ADT intensity of FrB protein in D0 and D7 STIA.
(J) Annotated subpopulations from merged D0 and D7 STIA CITE-seq data based on de novo clustering and overlap with D0 annotations.
(K) Pairwise Pearson’s correlation between the average expression profile at D7 STIA of annotated subpopulations.
(L) Mean ADT intensity of surface markers at D7 STIA across annotated subpopulations.
(M) Selected GO processes associated with genes that are increased in expression in TR-MCs at D7 STIA compared with D0.
(N–R) Expression of representative genes that are increased in expression in TR-MCs at D7 STIA across clusters stratified by time point.

