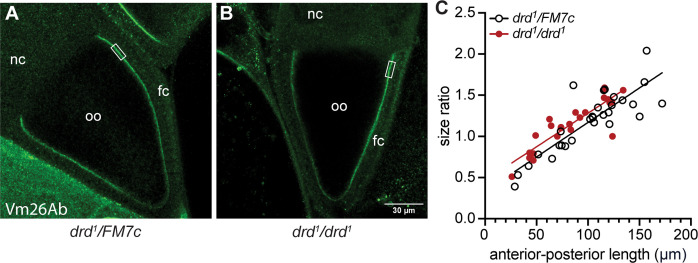
Fig 5. Immunostaining of the VM.
Stage 10A egg chambers from a drd1 heterozygote (A) and homozygote (B) were stained with the anti-Vm26Ab antibody. The rectangle indicates the region in which staining intensity and eggshell width were measured. Oo: oocyte; nc: nurse cells; fc: follicle cells. (C) Plot of the size ratio of anterior-posterior length/lateral width for each oocyte as a function of the anterior-posterior length. The lines are the result of simple linear regression of each dataset, showing the slight difference in Y-intercept between drd1 heterozygotes and homozygotes (F test, p<0.0001 for significant linear correlation of each dataset, p = 0.88 for comparison of slopes, p = 0.02 for comparison of Y-intercepts). n = 29 heterozygotes and 25 homozygotes.

