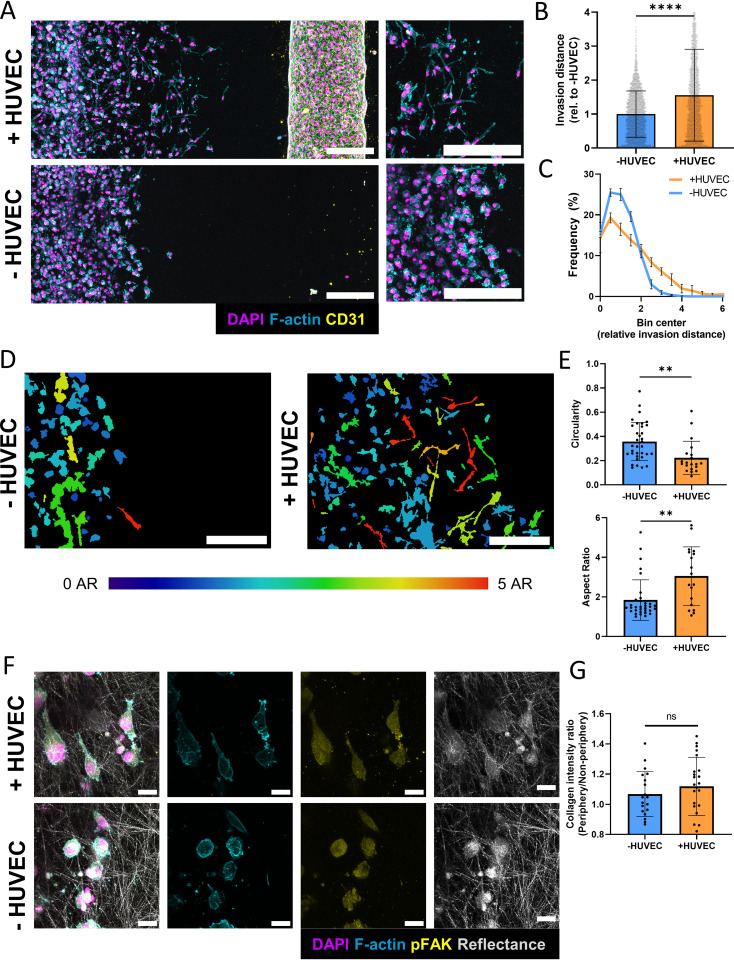
FIG. 2.
Endothelial cells increase cancer cell invasion and induce morphological changes. (a) Representative fluorescent confocal projections of tumor cells invading toward an EC-coated or empty channel (scale bar = 200 μm). (b) Quantification of invasion distance in microfluidic devices in either co-culture (+HUVEC) or tumor cell only (−HUVEC) conditions (n = 3 biological replicates, data points represent individual cells, error bars represent standard deviation). (c) Distribution of invasion distances in microfluidic devices (n = 3 biological replicates, data points represent individual cells, error bars represent standard deviation). (d) Representative image of cell shapes within microfluidic device pseudo-colored according to aspect ratio (AR). The left side of the images represent the edge of the tumor channel (scale bar = 200 μm). (e) Quantification of morphological characteristics of tumor cells within microfluidic devices (n = 3 biological replicates, data points represent individual cells, error bars represent standard deviation). (f) Representative confocal projections of tumor cells at the invasive front in microfluidic devices stained for F-actin and pFAK (scale bar = 20 μm). (g) Ratio of collagen intensity adjacent to cells relative to bulk collagen intensity in microfluidic devices (n = 3 devices, data points represent separate field of views (FOVs), n < 5 FOV per device). *p < 0.05, **p < 0.01, ****p < 0.0001.

