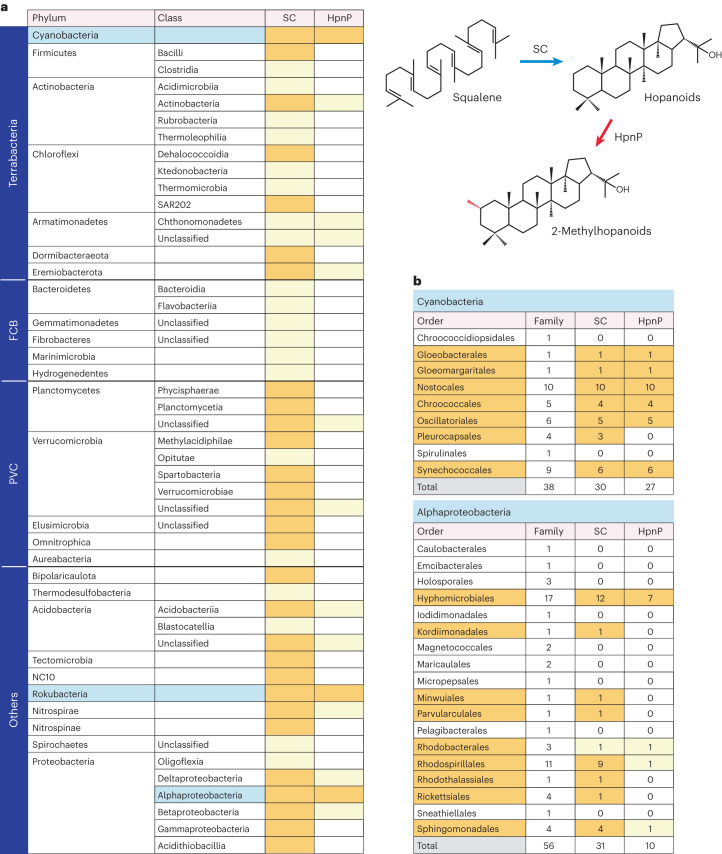
Fig. 1. Distribution of SC and HpnP in bacteria.
a, Distribution in individual bacterial phyla; only phyla that harbour SC are shown. Light yellow colour indicates that only a small number of species possess the gene (below 10% of available genomes). Note that the orange colour does not necessarily mean the gene is ubiquitous in a phylum. Individual proteobacterial classes are treated as phyla in the main text. Abbreviations: FCB, Fibrobacteres–Chlorobi–Bacteroidetes group; PVC, Planctomycetes–Verrucomicrobia–Chlamydiae group. b, Distribution of SC and HpnP within the phyla Cyanobacteria and Alphaproteobacteria. The number of families within individual orders is shown in the second column, while the number of families that contain SC and HpnP is shown in the third and the fourth columns, respectively. Supplementary Tables 1−5 provide the details within individual families.

