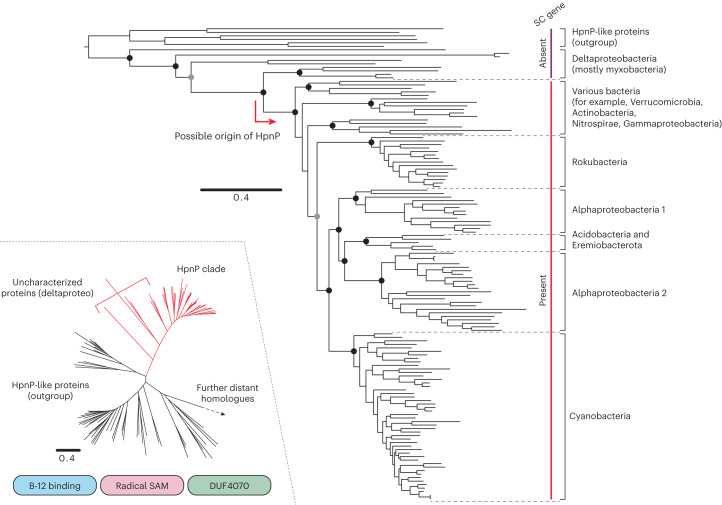
Fig. 2. Maximum likelihood tree of HpnP protein sequences.
The tree was generated using 135 representative sequences and 534 conserved sites. Filled black circles indicate that the node support is >85% for both maximum likelihood inference and Bayesian inference (node support is shown only for major clades). Filled grey circles indicate that the node support is above the same threshold for one of the two inferences. The presence/absence of the SC gene is indicated next to the tree. The insert displays major clades of HpnP homologues (HpnP and HpnP-like proteins) that retain three conserved domains; B-12 binding domain, radical SAM domain and DUF4070 domain. The scale bar represents 0.4 amino acid replacements per site per unit evolutionary time. Supplementary Figs. 1−3 provide the complete trees with the species annotation.

