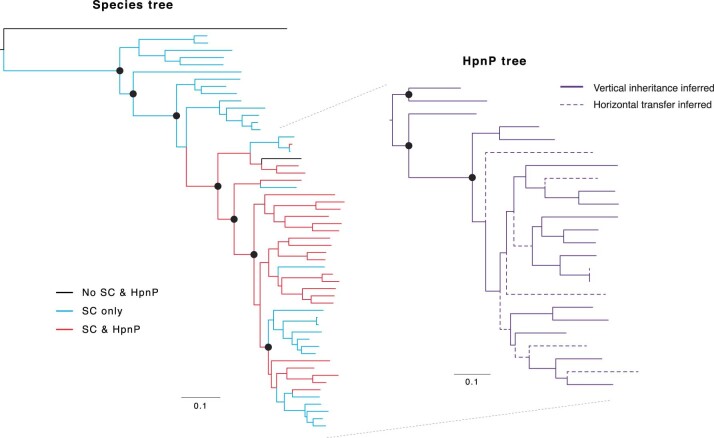
Extended Data Fig. 3. Distribution of HpnP in Rokubacteria.
A species tree that contained 56 representative rokubacterial species (Supplementary Fig. 7) was compared to the HpnP tree (Supplementary Fig. 8) through Notung reconciliation analyses (Supplementary Fig. 9). Solid lines in the HpnP tree indicate that they are consistent with the species tree. Dashed lines indicate that they are not consistent with the species tree and thus the presence of HGT is inferred by Notung. Filled black circles indicate that the node support is >85% (node support is shown only for major clades). The scale bar represents 0.1 amino acid replacements per site per unit evolutionary time.

