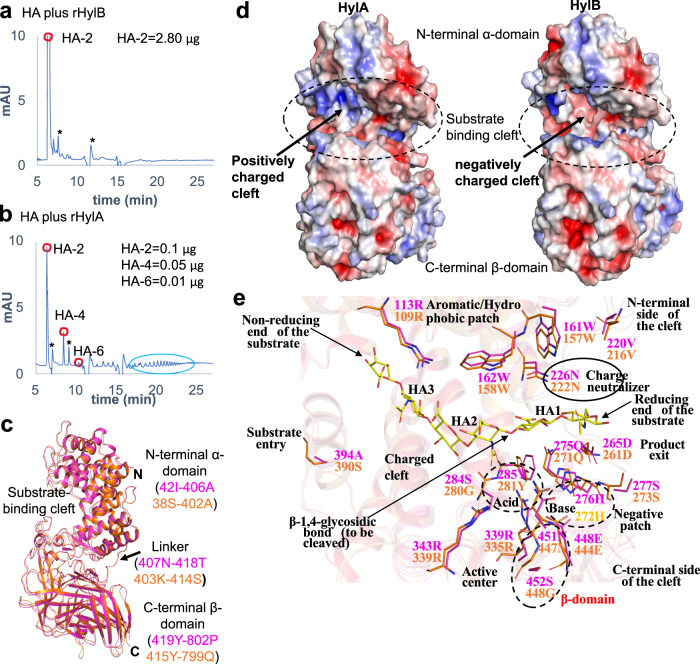
Fig. 2. HA degradation and structural features of HylA and HylB enzymes.
a, b HPLC profile of HMW-HA (2 mg/ml) digested for 24 hr with rHylB or rHylA (0.35 ug). Digested HA peaks (HA-2, −4 and −6) were quantified using known concentrations of purified HA oligosaccharides (see Supplementary Figs. 3, 4). Larger-sized HA fragments, highlighted with a green circle, were visualized only with rHylA-digested HA. Asterisk (*) in a, b represents non-specific peaks. The results are representative of at least 2 independent experiments. c comparison of HylA (PDB: 8FYG) and HylB (PDB: 8FNX) HylB crystal structures. HylA and HylB are shown by cartoon in magenta and orange, respectively. The structural domains, linker and substrate-binding cleft are labeled. d the electrostatic surface view is shown for the HylA and HylB crystal structures. The substrate binding cleft is highlighted in dashed oval. Red and blue correspond to potentials of −5 kT e−1 and 5 kT e−1, respectively. The electrostatic potentials were calculated by APBS in PyMol. e the residue-wise similarities and differences at the substrate-binding cleft of HylA and HylB. The HA-6 ligand is taken from the Streptococcus pneumoniae Hyl (SpHyl) crystal structure (PDB: 1LOH). Source data are provided as a Source Data file.

