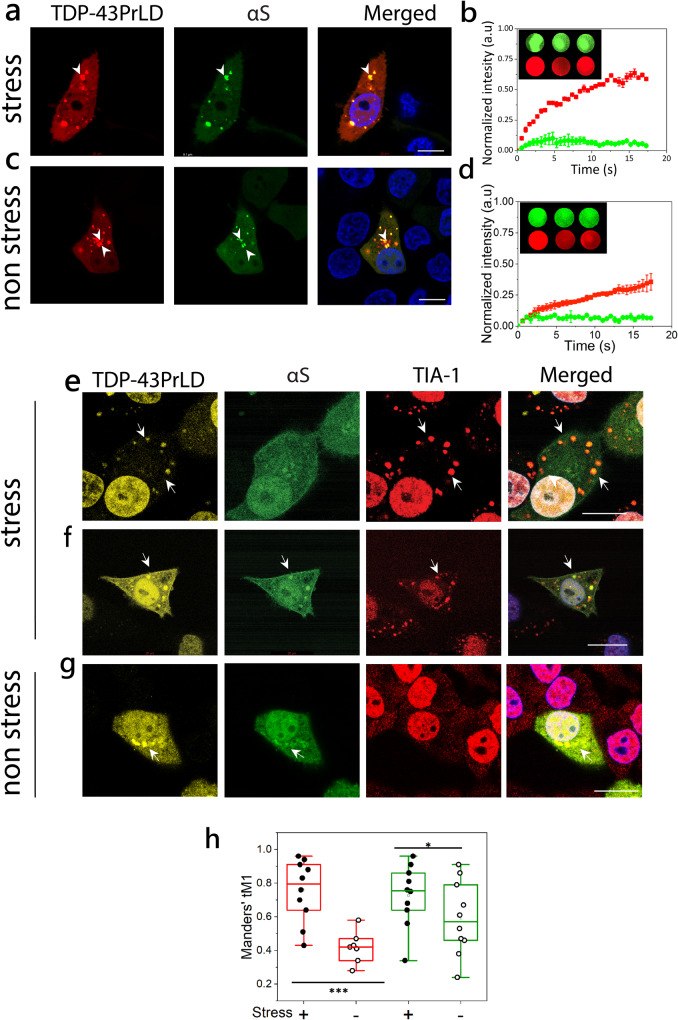
Fig. 1. Cytoplasmic colocalization of TDP-43PrLD and αS under stress and non-stress conditions.
a–d Confocal images of live HeLa cells co-expressing tdTomato-tagged TDP-43PrLD and GFP-tagged αS. a Cytoplasmic colocalization of TDP-43-PrLD and αS under treatment with sodium arsenite (0.5 mM, 20 min) to induce stress. c And under normal conditions (non-stress), arrows indicate a few of the colocalized puncta before and after arsenite treatment. Scale bar: 20 µm. b–d Normalized intensities of fluorescence recovery after photobleaching (FRAP) of colocalized TDP-43PrLD (red) and αS (green) under stress (b) and non-stress conditions (d). The recovery curves of at least three independent experiments were averaged and normalized. The inset shows representative pre-bleach, post-bleach, and recovery of the region of interest (ROI). e–g Immunostaining of the co-transfected TDP-43PrLD and αS HeLa cells along with the stress granule (SG) marker, TIA-1 under stress and non-stress conditions. e TDP-43PrLD colocalizes with TIA-1 in the cytoplasm (arrows) consistent with their presence in SGs. αS did not show localization in SGs in these cells. f Colocalization of TDP-43PrLD, αS, and TIA-1 in the stressed Hela cells (arrows) Scale bar: 20 µm. g Colocalization of TDP-43PrLD and αS in the cytoplasm in non-stressed conditions. A total of 33 positive cells for co-expression were analyzed (n = 33). h Whisker plot illustrating Manders’ tM1 coefficient for colocalized TDP-43PrLD, and αS. The red boxes denote immunostaining of colocalized TDP-43PrLD and TIA-1 during stress (solid circles) and non-stress (open circles). The green boxes denote the colocalization of TDP-43PrLD and αS under stress (solid circles) and under non-stress (open circles) conditions. A two-way ANOVA with p* < 0.001 and p*** < 0.01. All images were processed using FIJI (image J) and puncta were counted using ComDet plugin, and Gaussian blur filter was utilized to enhance puncta visibility. JACoP plugin used for Manders’ tM1 and tM2 coefficient calculation for each channel, each data point represents the value of an independent cell (n = 10 and 7(for non-stress live cells)).

