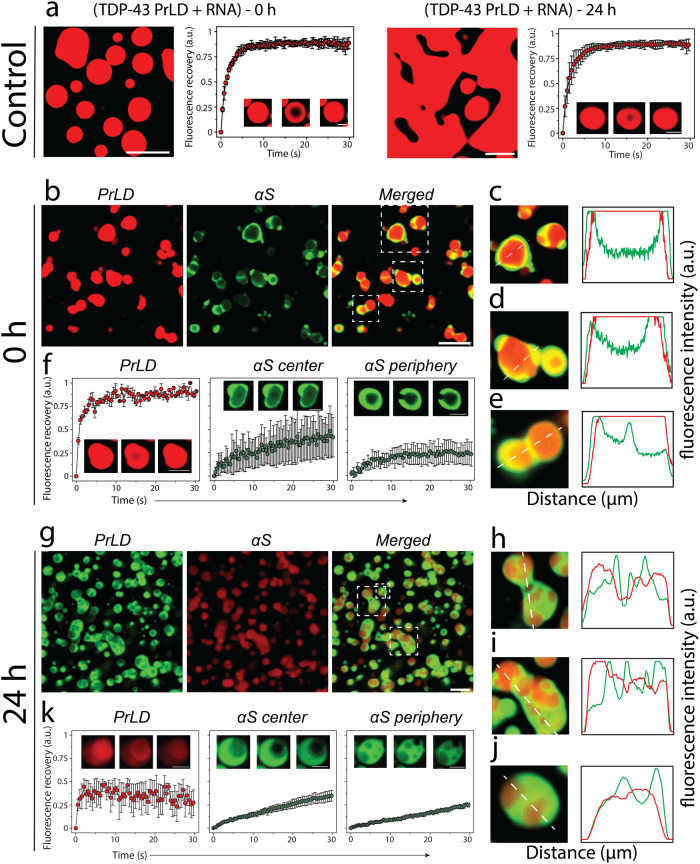
Fig. 4. Effect of αS on TDP-43PrLD – poly-A RNA condensates.
a Confocal microscopy image showing the phase separation of fluorescently labeled 15 µM TDP-43PrLD in the presence of poly-A RNA at 0 h and 24 h along with their respective fluorescence recovery after photobleaching (FRAP) kinetics. Insets from left to right show pre-bleach, during bleach, and post-bleach of the liquid droplets, respectively. b Images were taken right after incubation (0 h) showing the partitioning of αS in the pre-formed TDP-43PrLD—RNA liquid droplets with TDP-43PrLD (red), αS (green), and overlay (yellow). c FRAP data on TDP-43PrLD and αS from the samples in (b) (n = 3). Images in the inset indicate pre-bleach, during bleach, and post-bleach states, respectively. d–f Partitioning analysis of αS based on fluorescence intensity of the representative droplets from (b) (white boxes). The intensity plot as a function of distance corresponds to the white dotted line drawn through the droplets. g–k Confocal microscopy images and FRAP data of the reactions in (b, c) after 24 h along with their respective partitioning analysis (i, k). (Scale bar of images = 5 µm, FRAP insets = 2 µm).

