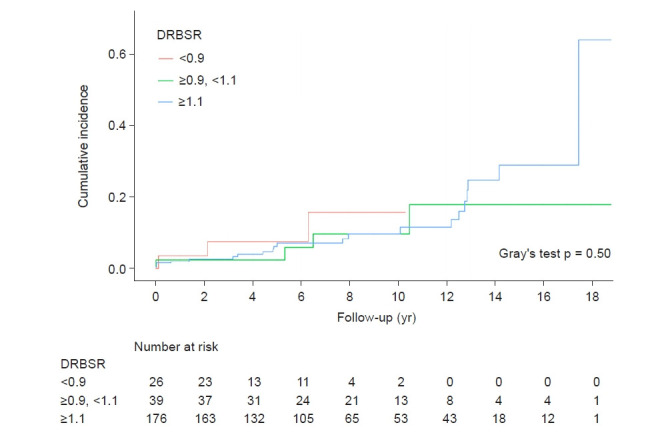
Figure 4. Cumulative incidence curves using Fine and Gray’s subdistribution hazard model.

Donor–recipient body surface area ratio (DRBSR) of <0.9, ≥0.9 to <1.1, and ≥1.1 were the major exposure variables. Gray’s test showed that the curves did not differ significantly from each other.
