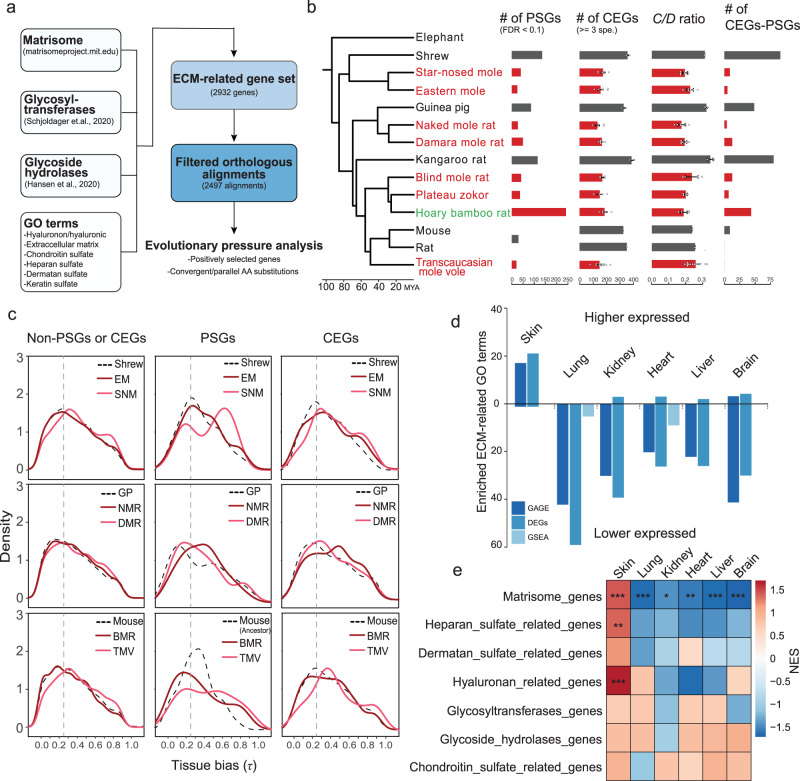
Fig. 6. Selection pressure analysis and regulatory changes in ECM-related genes in subterranean species.
a Diagram showing the analysis workflow. b Phylogenetic tree of species in this study and the numbers of positively selected genes (PSGs), convergently evolving genes (CEGs), convergent-to-divergent site ratio (C/D ratio; >3 species) and genes with both positive selection sites and convergent sites (CEGs-PSGs). Data are mean ± SD of CEGs and C/D ratio resulting from different four species combinations. The number of four-species combinations are: shrew n = 2, star-nosed mole n = 6, eastern mole n = 6, guinea pig n = 2, naked mole rat n = 6, Damaraland mole rat n = 6, kangaroo rat n = 2, blind mole rat n = 4, plateau zokor n = 4, hoary bamboo rat n = 4, mouse n = 1, rat n = 1, and Transcaucasian mole vole n = 12. Subterranean species are shown in red. c Tissue bias (measured by the statistic τ) distribution of PSGs, CEGs and non-PSGs or -CEGs in subterranean species (light and dark red lines) and their corresponding aboveground control species (dashed black line). PSGs and CEGs are combined gene sets from analysis with and without plateau zokor and hoary bamboo rat. Vertical dashed lines indicate τ = 0.25. Genes with τ > 0.25 were considered tissue-specific genes. d The number of ECM-related GO terms enriched by genes that are consistently up- or down-regulated across subterranean species compared to aboveground controls. Different methods show a similar pattern. GAGE: Generally Applicable Gene-set Enrichment analysis using the normalized expression matrix as input; DEGs: over-representation analysis using differentially expressed genes identified by comparing all subterranean species to all above ground species; GSEA: gene set enrichment analysis using the ranked fold changes from DEG analysis. e Heatmap showing NES scores from gene set enrichment analysis for the custom ECM-related gene sets. The P values are calculated using a one-sided permutation-based approach and were adjusted for multiple testing with Benjamini-Hochberg (BH) correction. *P.adjust < 0.05, **P.adjust < 0.01, ***P.adjust < 0.001.

