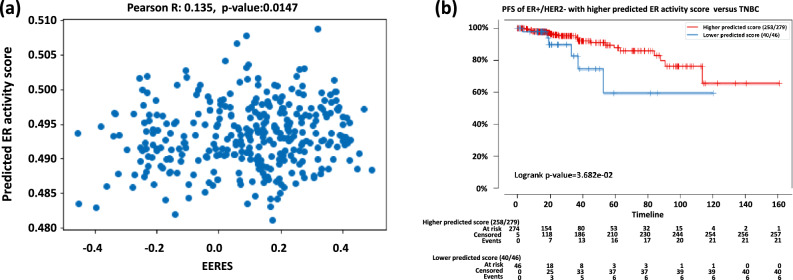
Figure 3.
Model performance with testing data. After training, we evaluated the model with unseen testing patient cohort from Broad Institute of MIT (n = 812). The predicted scores for each sample were output by the trained model, and (a) the scatter plot showing the correlation between the EERES and the predicted ER activity score of ER + /HER2- patients is shown. The best-predicted score threshold was used to stratify patients as higher or lower predicted ER activity score groups and their (b) PFS is shown as Kaplan–Meier curves for the ER + /HER2- testing cohort. The ER + /HER2- patients with higher and lower predicted ER activity score were compared for their survival using Kaplan–Meier curve.

