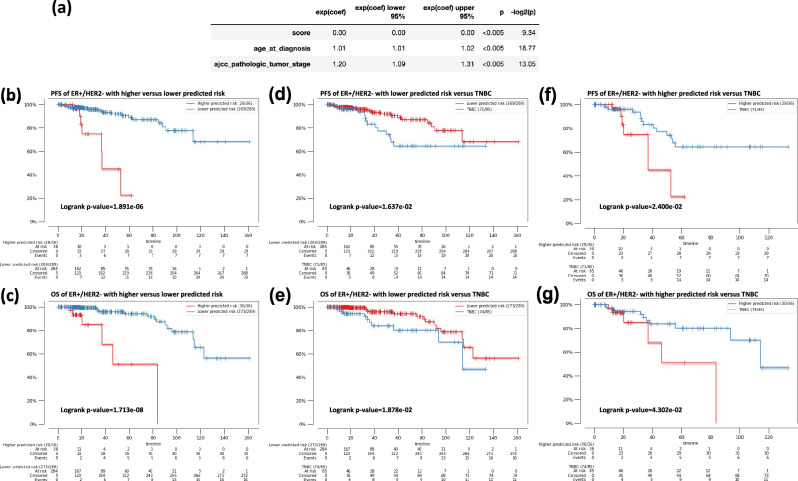
Figure 4.
Survival analyses of ER + /HER2- breast cancer patients with lower and higher predicted risk score from CoxPH models. (a) The multivariate correlation analysis of the predicted ER activity score, diagnostic age, and stage of testing samples with PFS. Exp(coef) is the hazard ratio (HR), The upper and lower 95% were the 95% confidence interval. P corresponds to the p-value. A predicted risk score for each testing sample in the testing cohort was generated using model fitted using ER activity score, clinical data and PFS of the training cohort. ER + /HER2- patients were assigned with a higher and lower predicted risk for PFS using a quantile 0.9 as cut-off. (b) Comparison of progression free survival (PFS) of predicted higher risk ER + /HER2- patients with lower risk ER + /HER2- patients. (c) Comparison of overall survival (OS) of predicted higher risk ER + /HER2- patients with lower risk ER + /HER2- patients. (d) Comparison of PFS of predicted lower risk ER + /HER2- patients with triple negative breast cancer (TNBC) patients. (e) Comparison of OS of predicted lower risk ER + /HER2- patients with TNBC patients. (f) Comparison of PFS of predicted higher risk ER + /HER2- patients with TNBC patients. (g) Comparison of OS of predicted higher risk ER + /HER2- patients with TNBC patients.

