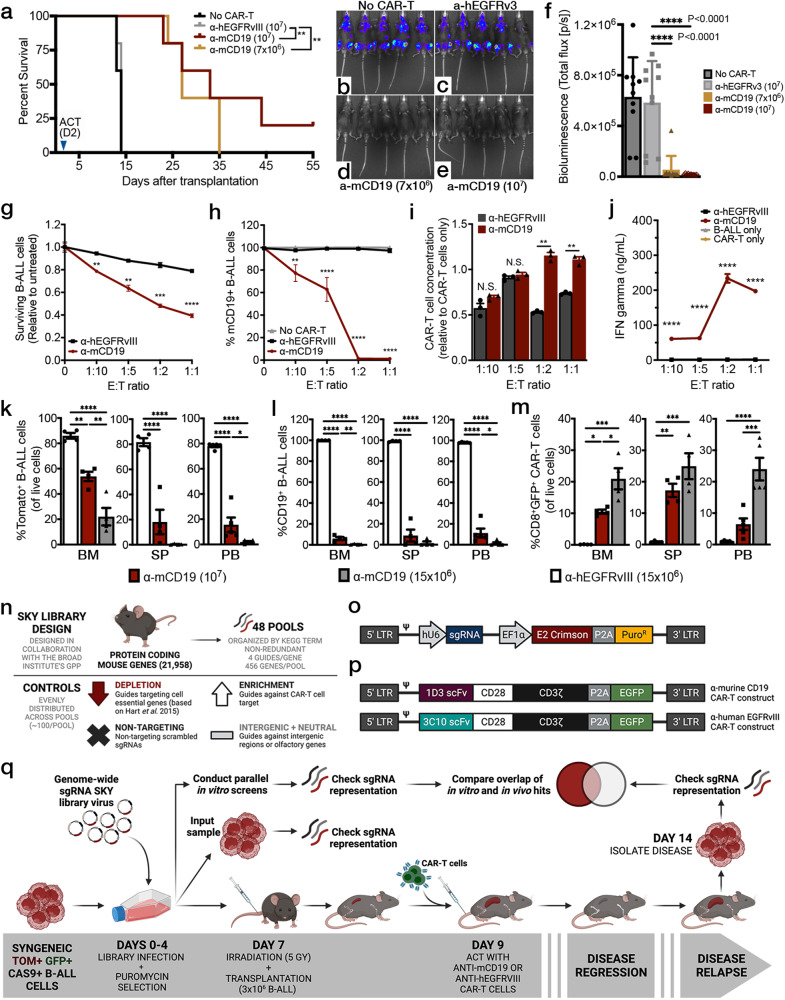
Fig. 1. A fully immunocompetent mouse model of BCR-ABL1+ B-ALL enables parallel in vivo and in vitro genome-wide screens for CAR-T resistance.
a Survival curves of irradiated B6 mice inoculated with B-ALL cells and treated with indicated CAR-T cell type. Both significant P values displayed = 0.0035. Bioluminescence imaging four days after adoptive cell transfer (ACT) in b untreated mice, c mice treated with 107 control CAR-T cells, d treated with 7 × 10⁶ anti-mCD19 CAR-T cells, or e treated with 107 anti-mCD19 CAR-T cells, and quantified in (f), both significant P values displayed <0.001; n = 10 mice per group from two independent experiments). g In vitro cytotoxicity assays show significant depletion of tumor cells along with h target epitope loss when B-ALL cells are treated with anti-mCD19 CAR-T cells at increasing effector to target cell (E:T) ratios. i Concomitantly, CAR-T cells expand and j release IFNγ when co-cultured with mCD19+ B-ALL cells. For (g–j), n = 3 biologically independent samples per group except for (j) where n = 6 biologically independent samples for the B-ALL only group. k–m Experiments to determine the appropriate CAR-T cell dose for either the bone marrow (BM) or spleen (SP) using flow cytometry analysis. Peripheral blood (PB) was also assessed (n = 4 mice per group). l Target epitope loss and m significant CAR-T cell persistence was also observed in all of the organs harvested from mice treated with anti-mCD19 CAR-T cells. n Schematic showing the overall design and o lentiviral backbone used to create the SKY library. p Retroviral vectors encoding the 1D3 single chain variable fragment (scFv) targeting mCD19 (top) and the 3C10 scFv targeting hEGFRvIII (bottom). q Diagram of screening layout. Data are mean ± s.e.m. All experiments were repeated at least twice with representative data shown. The significance for survival experiments was determined using log-rank tests. For all other experiments, significance is determined using unpaired two-sided student’s t-tests with Bonferroni correction for multiple comparisons, or using one-way ANOVA with Tukey’s correction for multiple comparisons when more than two groups were compared. *P < 0.05; **P < 0.01; ***P < 0.001; ****P < 0.0001. Exact P values for each comparison shown in (g–j) and (k–m) can be found in Supplementary Data 3.

