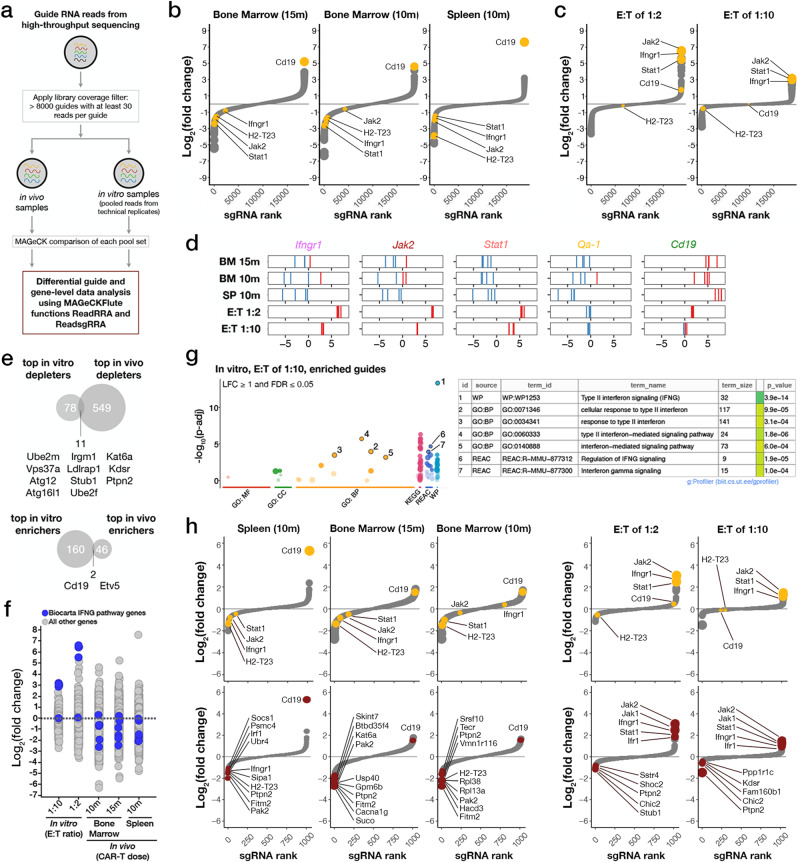
Fig. 2. In vivo genome-wide primary and subsequent validation CRISPR-Cas9-mediated knockout screens identify IFNγR/JAK/STAT signaling and antigen presentation pathways involved in resistance to CAR-T therapy.
a Schematic of the data analysis and screen hit discovery workflow. b, c Waterfall plots of log-fold changes of the representation of sgRNAs against different genes in anti-mCD19 CAR-T cell treated animals b or cells c compared to anti-hEGFRvIII CAR-T cell treated animals b or cells c at indicated doses (15 m or 1.5 × 10⁷ CAR-T cells, 10 m or 1 × 10⁷ CAR-T cells, effector to target (E:T) ratios of 1:2, or 1:10). For in vivo screens, the organ from which guide-bearing B-ALL cells were collected is also indicated. Genes are ranked by the average log2fold changes (L2FC) of all sgRNAs against each gene, and point sizes are proportional to the magnitude (absolute value) of L2FC. Waterfall plots display relative biological effect of each hit versus guide ranks. d Relative enrichment/depletion of individual guides against top depleting genes Ifngr1, Jak2, Stat1, and Qa-1b are shown in each arm of the screen. Guide RNAs against Cd19 are also shown as an indicator of CAR-T treatment pressure. Enriched gRNAs are shown in red. Depleted gRNAs are shown in blue. e Venn diagrams showing overlap of top hits from the primary in vitro and in vivo screens. f A strip chart representation of the L2FC of sgRNAs targeting genes in the Biocarta_IFNG_Pathway (shown in blue) upon treatment with Cd19 CAR-T cells in vitro (left two columns) or in vivo (right three columns). g (Left) A gprofiler plot showing the pathways targeted by the most enriched sgRNAs in the in vitro E:T of 1:10 treatment cohort. (Right) A table showing a list of pathways targeted by the most enriched sgRNAs. h Waterfall plots from the validation screen showing the representation of sgRNAs targeting different genes in anti-mCD19 CAR-T cell treated animals or cultured cells compared to control treated organs or cultured cells. Waterfall plots on top show sgRNAs targeting Cd19 and select interferon gamma pathway genes (in yellow). Waterfall plots below show the top ten depleted, or top five depleted/enriched sgRNAs in each context.

