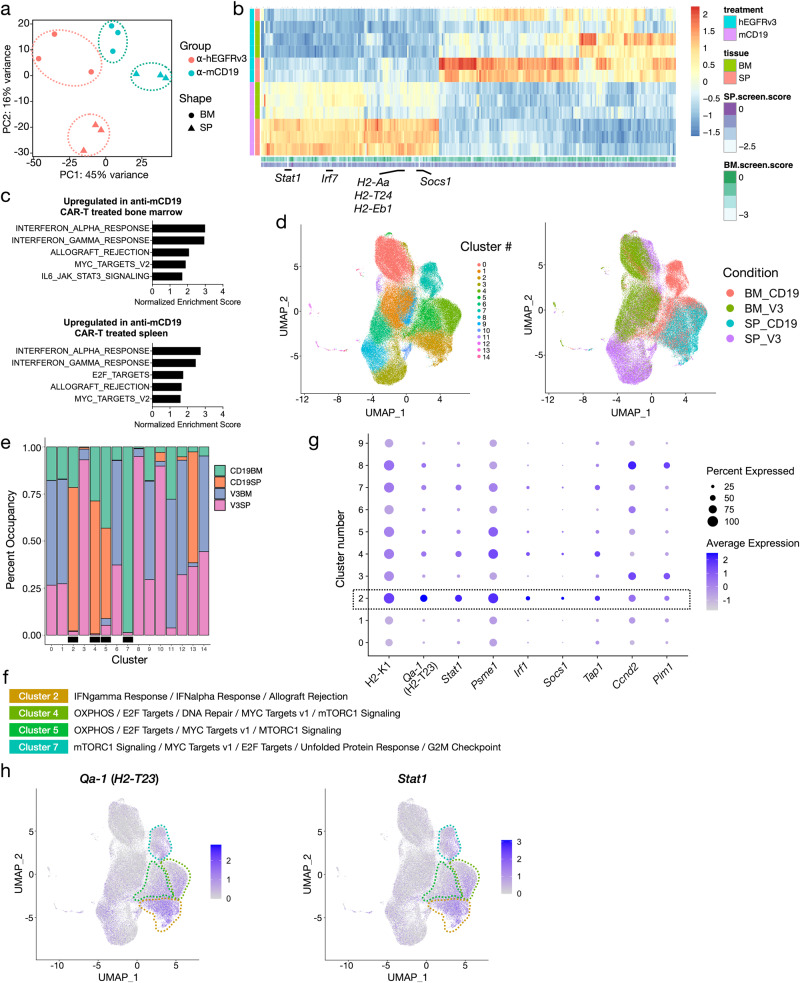
Fig. 5. Bulk and single cell gene expression profiling pinpoints specific cell subsets and expression programs as a source of CAR-T cell resistance in B-ALL.
a PCA plot of bulk RNA-seq profiles of bone marrow (BM) and spleen (SP) samples collected from mice treated with either anti-mCD19 or anti-hEGFRvIII (control) CAR-T cells. b Heatmap of genes differentially expressed between anti-mCD19 and anti-hEGFRvIII CAR-T cell-treated samples. Scores of genes from the screen are shown next to each gene’s expression profile (column). Top depleting sgRNAs in the BM and SP are labeled. c Top Hallmark gene sets enriched among genes overexpressed in mCD19 CAR-T cell therapy compared to control treated BM or SP samples. Bar graphs show normalized enrichment scores for each of the top 5 enriched pathways. Enrichment analysis was performed using GSEA and all pathways shown have FDR < 0.05. d 2-dimensional UMAP plots of single cell gene expression profiles collected from mice treated with either anti-mCD19 or anti-hEGFRvIII CAR-T cells. Data are collected from n = 3 mice per treatment group. Left: cells color-coded by clusters discovered through unsupervised clustering. Right: cells color-coded by treatment and tissue groups. e Participation of cells from each tissue/treatment group in each cluster. Bar graphs show percentage of cells in each cluster belonging to each tissue/treatment group (anti-mCD19 CAR-T cell treated BM or SP labeled CD19BM and CD19SP, respectively; anti-hEGFRvIII control CAR-T treated BM or SP labeled V3BM and V3SP, respectively). Clusters where there is substantial enrichment of cells under anti-mCD19 CAR-T therapy are marked with a black box underneath the bar plots. f Hallmark gene sets enriched in the 4 treatment-specific clusters as labeled in (e). g Dot plot showing relative expression patterns of cluster 2 genes which are also among top depleting sgRNAs (L2FC < −1.75) in the BM samples of the in vivo screen. Dot size is proportional to the percentage of cells in each cluster expressing each gene and dot color indicates average expression of each gene in each cluster. h UMAP plots showing expression of Qa-1b and Stat1 in single cell samples, with cells color-coded by expression levels.

