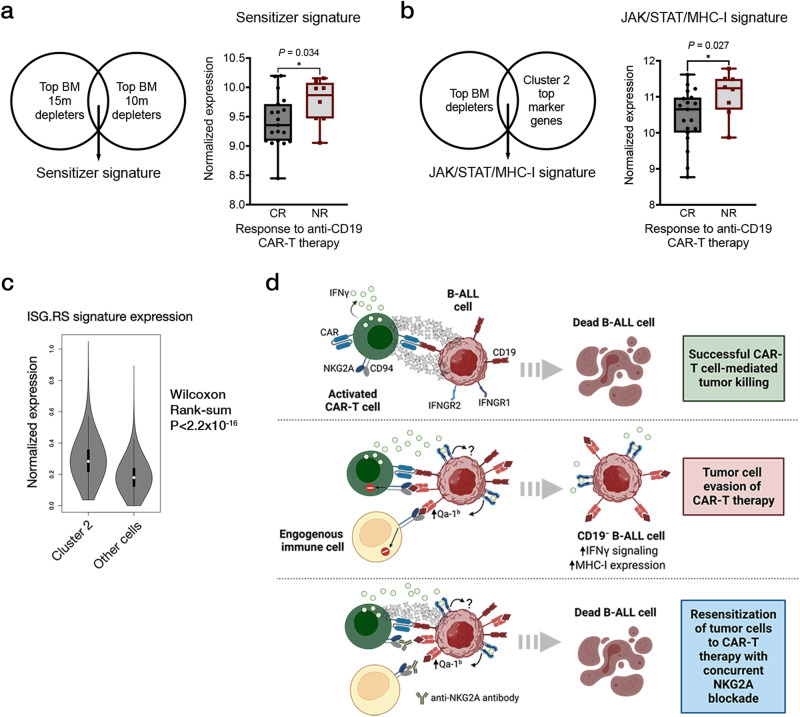
Fig. 6. JAK/STAT signaling is a potential therapeutic target in human B-ALL that can be exploited to enhance CAR-T therapy.
a Normalized expression of a sensitizer gene signature (composed of top depleting genes in the BM arms of our screen) in pre-treatment leukemia samples from patients who are complete responders (CR) or non-responders (NR) to anti-hCD19 CAR-T therapy. The five number summaries of the CR and NR boxplots are 8.45, 9.09, 9.36, 9.72, 10.20, and 9.05, 9.47, 9.87, 10.08, 10.15, respectively. b Normalized expression of a JAK/STAT/MHC-I resistance signature in the same pre-treatment leukemia samples shown in (a). The five number summaries of the CR and NR boxplots are 8.77, 10.01, 10.65, 10.98, 11.62, and 9.87, 10.64, 11.24, 11.50, 11.78, respectively. For (a-b), the plots are graphed from minima to maxima and all data points are overlaid. c Normalized expression of the immune checkpoint blockade resistance-associated interferon-stimulated genes (ISG.RS) signature in B-ALL cells (after CAR-T failure) residing in expression cluster 2 or other cells. The ISG.RS signature is associated with poor outcomes in patients with large B-cell lymphoma treated with anti-CD19 CAR-T cells. A two-sided Wilcoxon rank-sum test was performed to compare the two distributions shown. An exact P value cannot be numerically determined due to ties in rank sum tests. A numerically approximate P value is shown. The plots are graphed in the Tukey method. The five-number summary for cluster 2 cells (left) is 0.036, 0.22, 0.28, 0.36, 0.57, and 0, 0.12, 0.18, 0.24, 0.42 for all other cells (right). d A final model for how high IFNγR/JAK/STAT signaling in tumor cells can promote resistance to CAR-T therapy via the upregulation of the NK and CD8+ T-cell inhibitory molecule Qa-1b, the murine homolog of HLA-E. Except where indicated, significance is determined using unpaired two-sided student’s t-tests with Bonferroni correction for multiple comparisons. Data are mean ± s.e.m. *P < 0.05; **P < 0.01; ***P < 0.001; ****P < 0.0001.

